

Mechanisms underlying the frequency dependence of contraction and [Ca(2+)](i) transients in mouse ventricular myocytes
- PMID: 12231646
- PMCID: PMC2290543
- DOI: 10.1113/jphysiol.2002.025619
Mechanisms underlying the frequency dependence of contraction and [Ca(2+)](i) transients in mouse ventricular myocytes
Abstract
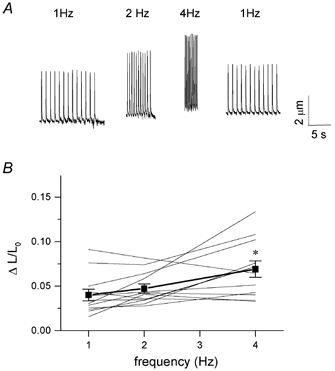
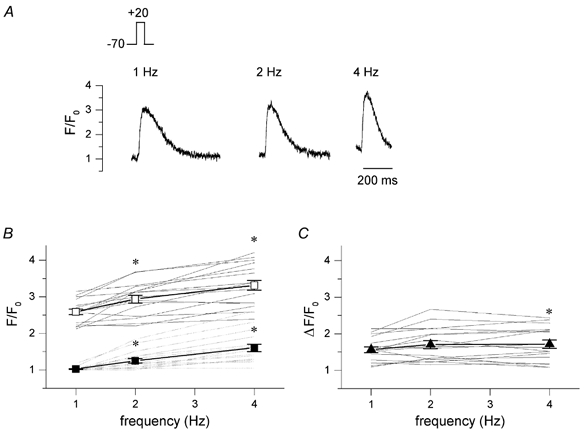
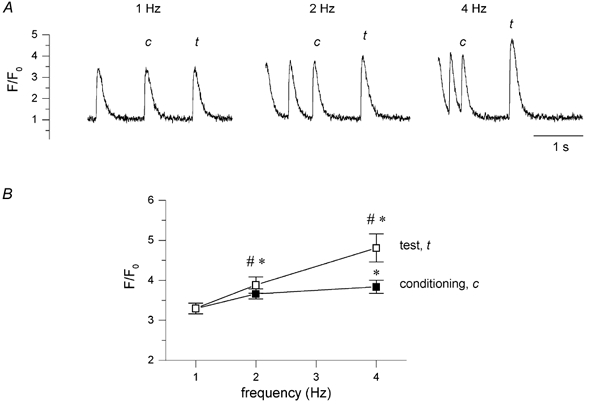
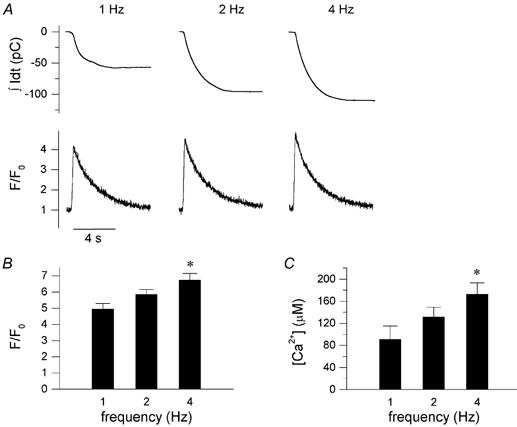
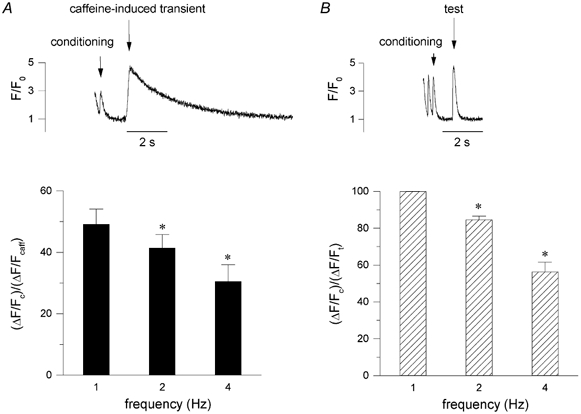
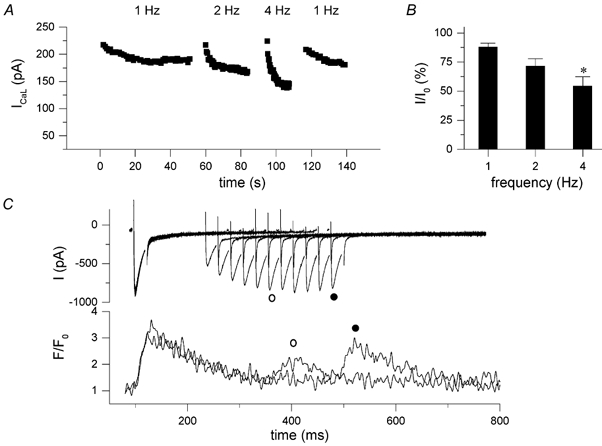
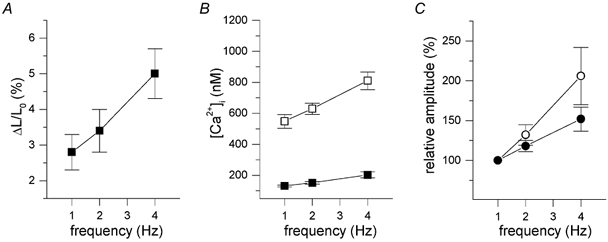
In most mammalian species force of contraction of cardiac muscle increases with increasing rate of stimulation, i.e. a positive force-frequency relationship. In single mouse ventricular cells, both positive and negative relationships have been described and little is known about the underlying mechanisms. We studied enzymatically isolated single ventricular mouse myocytes, at 30 degrees C. During field stimulation, amplitude of unloaded cell shortening increased with increasing frequency of stimulation (0.04 +/- 0.01 Delta L/L(0) at 1 Hz to 0.07 +/- 0.01 Delta L/L(0) at 4 Hz, n = 12, P < 0.05). During whole cell voltage clamp with 50 microM [K5-fluo-3](pip), both peak and baseline [Ca(2+)](i) increased at higher stimulation frequencies, but the net Delta[Ca(2+)](i) increased only modestly from 1.59 +/- 0.08 Delta F/F(0) at 1 Hz, to 1.71 +/- 0.11 Delta F/F(0) at 4 Hz (n = 17, P < 0.05). When a 1 s pause was interposed during stimulation at 2 and 4 Hz, [Ca(2+)](i) transients were significantly larger (at 4 Hz, peak F/F(0) increased by 78 +/- 2 %, n = 5). SR Ca(2+) content assessed during caffeine application, significantly increased from 91 +/- 24 micromol l(-1) at 1 Hz to 173 +/- 20 micromol l(-1) at 4 Hz (n = 5, P < 0.05). Peak I(Ca,L) decreased at higher frequencies (by 28 +/- 6 % at 2 Hz, and 45 +/- 8 % at 4 Hz), due to slow recovery from inactivation. This loss of I(Ca,L) resulted in reduced fractional release. Thus, in mouse ventricular myocytes the [Ca(2+)](i)-frequency response depends on a balance between the increase in SR content and the loss of trigger I(Ca,L). Small changes in this balance may contribute to variability in frequency-dependent behaviour. In addition, there may be a regulation of the contractile response downstream of [Ca(2+)](i).
Figures
Similar articles
-
Overexpression of human beta2-adrenergic receptors increases gain of excitation-contraction coupling in mouse ventricular myocytes.Am J Physiol Heart Circ Physiol. 2004 Sep;287(3):H1029-38. doi: 10.1152/ajpheart.00814.2003. Epub 2004 May 20. Am J Physiol Heart Circ Physiol. 2004. PMID: 15155261
-
Rate-dependent changes in cell shortening, intracellular Ca(2+) levels and membrane potential in single, isolated rainbow trout (Oncorhynchus mykiss) ventricular myocytes.J Exp Biol. 2000 Feb;203(Pt 3):493-504. doi: 10.1242/jeb.203.3.493. J Exp Biol. 2000. PMID: 10637178
-
R4496C RyR2 mutation impairs atrial and ventricular contractility.J Gen Physiol. 2016 Jan;147(1):39-52. doi: 10.1085/jgp.201511450. Epub 2015 Dec 14. J Gen Physiol. 2016. PMID: 26666913 Free PMC article.
-
Force-frequency relationship in intact mammalian ventricular myocardium: physiological and pathophysiological relevance.Eur J Pharmacol. 2004 Oct 1;500(1-3):73-86. doi: 10.1016/j.ejphar.2004.07.013. Eur J Pharmacol. 2004. PMID: 15464022 Review.
-
Increased SR Ca2+ cycling contributes to improved contractile performance in SERCA2a-overexpressing transgenic rats.Cardiovasc Res. 2005 Sep 1;67(4):636-46. doi: 10.1016/j.cardiores.2005.05.006. Cardiovasc Res. 2005. PMID: 15932750
Cited by
-
Tumor treating fields perturb the localization of septins and cause aberrant mitotic exit.PLoS One. 2015 May 26;10(5):e0125269. doi: 10.1371/journal.pone.0125269. eCollection 2015. PLoS One. 2015. PMID: 26010837 Free PMC article.
-
Mechanisms underlying local Ca2+ signalling differences between right and left atrial myocytes at normal and increased frequencies.J Physiol. 2025 Jul 22:10.1113/JP287884. doi: 10.1113/JP287884. Online ahead of print. J Physiol. 2025. PMID: 40694503 Free PMC article.
-
Role of CaMKIIdelta phosphorylation of the cardiac ryanodine receptor in the force frequency relationship and heart failure.Proc Natl Acad Sci U S A. 2010 Jun 1;107(22):10274-9. doi: 10.1073/pnas.1005843107. Epub 2010 May 17. Proc Natl Acad Sci U S A. 2010. PMID: 20479242 Free PMC article.
-
Staurosporine inhibits frequency-dependent myofilament desensitization in intact rabbit cardiac trabeculae.Biochem Res Int. 2012;2012:290971. doi: 10.1155/2012/290971. Epub 2012 May 9. Biochem Res Int. 2012. PMID: 22649731 Free PMC article.
-
Inactivation of Smad5 in endothelial cells and smooth muscle cells demonstrates that Smad5 is required for cardiac homeostasis.Am J Pathol. 2007 May;170(5):1460-72. doi: 10.2353/ajpath.2007.060839. Am J Pathol. 2007. PMID: 17456754 Free PMC article.
References
-
- Anderson ME. Ca2+-dependent regulation of cardiac L-type Ca2+ channels: is a unifying mechanism at hand? Journal of Molecular and Cellular Cardiology. 2001;33:639–650. - PubMed
-
- Bassani RA, MattiaIZZ A, Bers DM. CaMKII is responsible for activity-dependent acceleration of relaxation in rat ventricular myocytes. American Journal of Physiology. 1995;268:H703–712. - PubMed
-
- Bers DM. Excitation-Contraction Coupling and Cardiac Contractile Force. The Netherlands: Kluwer Academic Publishers; 2001.
Publication types
MeSH terms
Substances
LinkOut - more resources
Full Text Sources
Other Literature Sources
Research Materials
Miscellaneous