Influence of different cuff inflation protocols on capillary filtration capacity in human calves -- a congestion plethysmography study
- PMID: 12231656
- PMCID: PMC2290538
- DOI: 10.1113/jphysiol.2002.018291
Influence of different cuff inflation protocols on capillary filtration capacity in human calves -- a congestion plethysmography study
Abstract
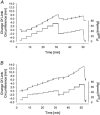
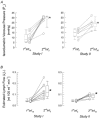
It has been suggested that venous congestion plethysmography (VCP) substantially underestimates microvascular permeability by activation of a veni-arteriolar constrictor mechanism, even when using small (< 25 mmHg) congestion pressure steps. We studied human lower limbs of 18 young healthy volunteers to test whether the congestion pressure step size of the VCP protocol has an influence on the values of the capillary filtration capacity (CFC) and isovolumetric venous pressure (P(vi)). Two different dual stage VCP pressure step protocols, with 3 and 10 mmHg steps, were used in randomised order and separated by a transient reduction in congestion pressure. Since lymph flow is known to increase after venous congestion, we also looked to see if changes in the estimated lymph flow (J(v)L) occur as a result of these VCP protocols. The measured CFC (median [25th; 75th percentile]) was 2.6 [2.5; 3.2] x 10(-3) ml (100 ml)(-1) min(-1) mmHg(-1) with the 3 mmHg pressure step protocol, which was not different from the value of 2.9 [2.7; 3.4] x 10(-3) ml (100 ml)(-1) min(-1) mmHg(-1) obtained with 10 mmHg pressure steps. However, when either of these step sizes was applied after a transient venous decongestion, significantly higher values of CFC, 4.0 [3.4; 4.1] x 10(-3) and 3.5 [3.1; 4.5] x 10(-3) ml (100 ml)(-1) min(-1) mmHg(-1), respectively, were obtained (P < 0.05). The assessment of P(vi) was also independent of the pressure protocol (10 mmHg: 8.0 [5.7; 13.2] mmHg and 3 mmHg: 15.7 [12.5; 18.5] mmHg), but when P(vi) was measured after the transient deflation, significantly higher values were found with both 10 and 3 mmHg steps (24.1 [20.9; 27.3] and 30.4 [28.9; 30.9] mmHg, respectively; P < 0.01). The transient pressure reduction was associated with a rise in estimated J(v)L from 0.04 [0.03; 0.05] to 0.12 [0.08; 0.18] and 0.04 [0.04; 0.05] to 0.09 [0.07; 0.10] ml (100 ml)(-1) min(-1), respectively (P < 0.01). The first stage data from these protocols shows that the value of CFC is not influenced by the size of the cumulative venous pressure steps, providing they are of 10 mmHg or less. The data also show that J(v)L can be estimated with small step VCP protocols. We hypothesise that the sudden reduction in cuff pressure after venous congestion is associated with a temporary upregulation of lymph flow. As the congestion pressure is raised again, there is a modulation of the enhanced lymph flow, such that the resulting CFC slope appears greater than that obtained in the first stage of the protocol.
Figures


Similar articles
-
Can lymphatic drainage be measured non-invasively in human limbs, using plethysmography?Clin Sci (Lond). 2004 Jun;106(6):627-33. doi: 10.1042/CS20030314. Clin Sci (Lond). 2004. PMID: 14763898
-
Assessment of the peripheral microcirculation using computer-assisted venous congestion plethysmography in post-traumatic complex regional pain syndrome type I.J Vasc Res. 2001 Sep-Oct;38(5):453-61. doi: 10.1159/000051078. J Vasc Res. 2001. PMID: 11561147
-
Human calf precapillary resistance decreases in response to small cumulative increases in venous congestion pressure.J Physiol. 1998 Mar 1;507 ( Pt 2)(Pt 2):611-7. doi: 10.1111/j.1469-7793.1998.611bt.x. J Physiol. 1998. PMID: 9518718 Free PMC article. Clinical Trial.
-
Inhibition of prostaglandin synthesis does not alter the decrease in pre-capillary resistance in the human calf in response to small cumulative increases in venous congestion.Clin Sci (Lond). 2005 Sep;109(3):303-9. doi: 10.1042/CS20050113. Clin Sci (Lond). 2005. PMID: 15898957
-
Sudden Congestion and Death.Med Chir Rev. 1826 Jul;5(9):292-293. Med Chir Rev. 1826. PMID: 29919653 Free PMC article. Review. No abstract available.
Cited by
-
Endothelial Function in Pulmonary Arterial Hypertension: From Bench to Bedside.J Clin Med. 2024 Apr 22;13(8):2444. doi: 10.3390/jcm13082444. J Clin Med. 2024. PMID: 38673717 Free PMC article. Review.
-
[Microcirculatory monitoring of sepsis].Anaesthesist. 2005 Dec;54(12):1163-75. doi: 10.1007/s00101-005-0948-5. Anaesthesist. 2005. PMID: 16284737 Review. German.
-
A Novel Non-Invasive Device for the Assessment of Central Venous Pressure in Hospital, Office and Home.Med Devices (Auckl). 2021 May 13;14:141-154. doi: 10.2147/MDER.S307775. eCollection 2021. Med Devices (Auckl). 2021. PMID: 34012302 Free PMC article.
-
Overview of the Assessment of Endothelial Function in Humans.Front Med (Lausanne). 2020 Oct 7;7:542567. doi: 10.3389/fmed.2020.542567. eCollection 2020. Front Med (Lausanne). 2020. PMID: 33117828 Free PMC article. Review.
References
-
- Aukland K, Reed RK. Interstitial-lymphatic mechanisms in the control of extracellular fluid volume. Physiological Reviews. 1993;73:1–78. - PubMed
-
- Brown MD, Jeal S, Bryant J, Gamble J. Modifications of microvascular filtration capacity in human limbs by training and electrical stimulation. Acta Physiologica Scandinavica. 2001;173:359–368. - PubMed
-
- Christ F, Bauer A, Brugger D, Niklas M, Gartside IB, Gamble J. Description and validation of a novel liquid metal-free device for venous congestion plethysmography. Journal of Applied Physiology. 2000;89:1577–1583. - PubMed
-
- Christ F, Dellian M, Goetz AE, Gamble J, Messmer K. Changes in subcutaneous interstitial fluid pressure, tissue oxygenation, and skin red cell flux during venous congestion plethysmography in men. Microcirculation. 1997a;4:75–81. - PubMed
Publication types
MeSH terms
LinkOut - more resources
Full Text Sources
Other Literature Sources
Research Materials
Miscellaneous

