. 2002 Sep 16;21(18):4809-19.
doi: 10.1093/emboj/cdf499.

Pleiotropic defects in TCR signaling in a Vav-1-null Jurkat T-cell line

Affiliations

Pleiotropic defects in TCR signaling in a Vav-1-null Jurkat T-cell line

Youjia Cao et al. EMBO J. .

Abstract

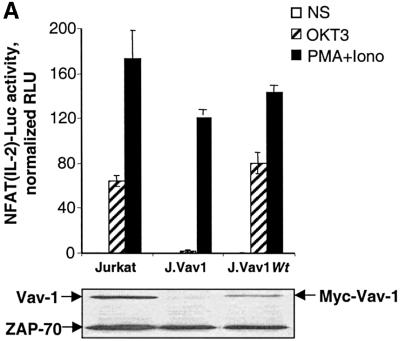
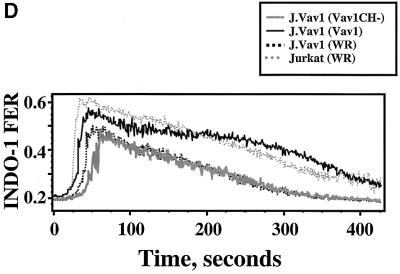
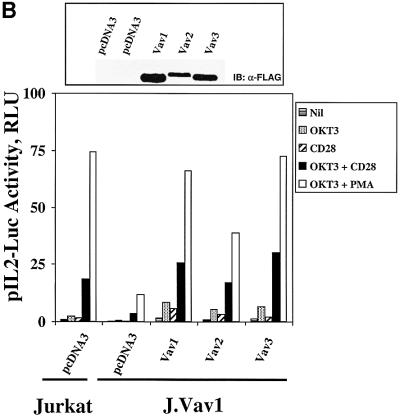
The Rac/Rho-specific guanine nucleotide exchange factor, Vav-1, is a key component of the T-cell antigen receptor (TCR)-linked signaling machinery. Here we have used somatic cell gene-targeting technology to generate a Vav-1-deficient Jurkat T-cell line. The J.Vav1 cell line exhibits dramatic defects in TCR-dependent interleukin (IL)-2 promoter activation, accompanied by significant reductions in the activities of the NFAT(IL-2), NFkappaB, AP-1 and REAP transcription factors that bind to the IL-2 promoter region. In contrast, loss of Vav-1 had variable effects on early TCR-stimulated signaling events. J.Vav1 cells display a selective defect in sustained Ca(2+) signaling during TCR stimulation, and complementation of this abnormality by exogenously introduced Vav-1 is dependent on the Vav-1 calponin homology domain. While JNK activation was severely impaired, the stimulation of Ras, ERK and protein kinase C-theta activities, as well as the mobilization of lipid rafts, appeared normal in the J.Vav1 cells. Finally, evidence is presented to suggest that the alternative Vav family members, Vav-2 and Vav-3, are activated during TCR ligation, and partially compensate for the loss of Vav-1 in Jurkat T cells.


Figures

None
Fig. 1. Vav-1 gene-targeting strategy. (A) The promoterless targeting vector contained a bicistronic selection cassette encoding GFP and Neor (open boxes). Two targeting plasmids were generated for sequential disruption of both Vav-1 alleles. The 5′-flanking region in the first construct spanned exons 2–4 (∼1.1 kb) of the human Vav-1 gene, while the second vector contained a 5′-homologous region derived from exons 5–7 (∼2.4 kb) of Vav-1. Both targeting vectors contained a 3′-homologous region spanning exons 24–27 (∼7 kb) from the Vav-1 gene. The respective targeted Vav-1 alleles are depicted in the lower portion of the figure, along with the DNA probe used for Southern blot analyses of the Vav-1 gene loci. Primers used for clone screening and RT–PCR are indicated with arrowheads. The ApaI (A) restriction sites used for Southern analysis are indicated in the figure, along with the predicted size of the genomic restriction fragments from the targeted Vav-1 alleles. (B) Southern blot analysis of genomic DNA isolated from cells containing wild-type Vav-1 (+/+), a Vav-1+/– heterozygous clone (+/–) and three Vav-1–/– nullizygotes. Note the presence of a third, non-disrupted Vav-1-related genomic sequence in each of the Vav-1–/– clones. (C) Vav-1 protein expression. Detergent-soluble proteins were immunoblotted with α-Vav-1 antibodies, followed by α-ZAP-70 antibodies as a control for protein loading. (D) RT–PCR analysis. The amplification products were obtained with primers f and r3 (see A). The predicted PCR product from the wild-type Vav-1 cDNA is 2 kb.
None
Fig. 2. TCR-mediated IL-2 promoter activation in J.Vav1 cells. Cells were co-transfected with 10 µg of pIL2-luc DNA, 2 µg of pRL-TK DNA and, where indicated, 4 µg of Vav-1-encoding plasmid DNA. After 18 h, the transfected cells were left unstimulated (open bars), or were stimulated with Raji B cells in the absence (horizontal bars) or presence (hatched bars) of superantigen D (SED). The pIL2-Luc (firefly luciferase) activities were measured and were normalized to the pRL-TK-derived Renilla luciferase activity in each sample. Data are presented as the mean normalized relative light units (RLU) from triplicate samples.
None
Fig. 3. TCR-dependent NFAT activation. (A) Cells were transfected with 5 µg of pNFAT(IL2)-Luc reporter plasmid, together with the control pRL-TK plasmid. The J.Vav1WT subline was derived by stable transfection of J.Vav1 cells with a wild-type (Wt) Vav-1 expression plasmid. At 18 h post-transfection, the cells were stimulated for 6 h with the indicated agents. The pNFAT(IL2)-Luc activity measured in each sample was normalized to the Renilla luciferase activity to control for transfection efficiency. Bars represent the mean ± standard deviation from triplicate samples. The lower panel indicates the level of Vav-1 protein in each cell population, as determined by immunoblotting. (B) J.Vav1 cells were co-transfected with the pNFAT(IL2)-Luc reporter, plus 10 µg of either wild-type Vav-1 or Vav-1 CH plasmid DNA. Bars represent the mean luciferase activities from duplicate samples, after normalization to the maximal response obtained with ionomycin plus PMA. The inset shows the expression levels of the FLAG-tagged Vav proteins.
None
Fig. 4. TCR-dependent Ca2+ signaling in J.Vav1 cells. (A) TCR-mediated Ca2+ mobilization. Jurkat, J.Vav1 and J.Vav1WT cells were loaded with the Ca2+ indicator dye Indo-1, and then stimulated with OKT3 mAb cross-linked with GαMIg. Changes in [Ca2+]i were monitored by flow cytometry. The data are presented as the fluorescence emission ratio (FER) of the Ca2+-bound and -unbound forms of Indo-1. (B) Tyrosine phosphorylation of PLCγ1. Cells were stimulated for the indicated times with OKT3 plus GαMIg, and detergent extracts were immunoprecipitated with α-PLCγ1 antibody. After SDS–PAGE, the samples were sequentially immunoblotted (IB) with α-pTyr mAb (top) and α-PLCγ1 antibody. (C) IP3 production. Cells were stimulated as described in (A) and IP3 levels were quantitated with a radioreceptor assay. Bars indicate the mean ± standard deviation from triplicate samples. (D) Role of the CH domain in TCR-mediated Ca2+ mobilization. Jurkat or J.Vav1 cells were infected with non-recombinant vaccinia virus (WR), or with recombinant virus encoding wild-type Vav-1 or the Vav-1 CH mutant. The cells were loaded with Indo-1, stimulated with OKT3 mAb and analyzed for [Ca2+]i as described in (A).
None
Fig. 5. Roles of Vav1 in MAP kinase activation. (A) Ras–ERK activation. Jurkat or J.Vav1 cells (2 × 10⁶ cells/sample) were stimulated with OKT3 or PMA for the indicated times, and GTP-bound Ras was precipitated with a GST–RBD fusion protein. The precipitated protein was subjected to SDS–PAGE and immunoblotting with α-Ras mAb (upper panel). Detergent extracts were resolved by SDS–PAGE, and immunoblotted sequentially with α-phospho-ERK (α-p-ERK) and α-ERK 1/2 antibodies (middle and lower panels). (B) JNK activation. Cells (2 × 10⁶ per sample) were exposed for 10 min to the indicated stimuli, and JNK activities were determined in immune complex kinase assays, with GST-c-Jun1–79 as the substrate. The incorporation of radioactivity from [γ-32P]ATP into substrate was visualized by autoradio graphy (middle panel) and quantitated by phosphoimaging (upper panel). The amount of JNK protein present in each sample is shown in the lower panel.
None
Fig. 6. Requirement of Vav-1 for TCR-dependent AP-1 activation. (A) Jurkat cells were co-transfected with 3 µg of pAP1-Luc reporter construct plus 0.5 µg of pRL-TK. Where indicated, the JVav1 cells were additionally transfected with pcDNA3 (30 µg), Rac1 (Q/L) (10 µg), myc-tagged wild-type Vav-1 (wtVav1; 3 µg) or Vav-1 Dbl-homology domain mutant (L213A; 10 µg). After 18 h, the cells were stimulated for 6 h and luciferase activities were determined. The pAP1-Luc-derived luciferase activity was normalized to the Renilla luciferase activity in each sample. The results are presented as the mean ± standard deviation from triplicate samples. Aliquots from representative samples were immunoblotted to indicate expression levels of the various Vav-1 proteins (lower panel). The blot was re-probed with α-ZAP-70 antibodies to control for protein loading. (B) Activation of AP-1-dependent transcription by Vav-1 CH mutant. Cells were transiently transfected with the pAP1-Luc plus the indicated Vav-1 expression plasmid (10 µg), and luciferase activities were measured as described in (A). Luciferase activities in each sample were normalized to the maximal levels obtained in cells stimulated with ionomycin plus PMA. Bars represent mean values from duplicate samples. The right panel shows expression levels of the FLAG-tagged Vav proteins.
None
Fig. 7. TCR/CD28-mediated PKC-θ translocation in J.Vav1 cells. Jurkat or J.Vav1 cells were stimulated with 1 µg/ml OKT3 plus 1 µg/ml α-CD28 antibodies. The cells were subjected to a serial extraction protocol (see Materials and methods) and extracts were immunoblotted with the indicated antibodies. The digitonin-extractable fraction contains mainly cytoplasmic (C) proteins, whereas the NP-40-soluble fraction includes membrane-associated proteins (M).
None
Fig. 8. CTxB-induced raft clustering. Jurkat (AF) or J.Vav1 (GL) cells were labeled with CtxB–FITC and incubated with goat α-CTxB for 15 min at 37°C. Cells were fixed and stained with a control IgG (A–C, G–I) or with α-PKC-θ (D–F, J–L). PKC-θ (red) was detected with TRITC-conjugated GαMIg (A, D, G and J), and was analyzed for co-localization with CTxB–FITC (green)-labeled lipid raft clusters (B, E, H and K). Merged images are shown in (C), (F), (I) and (L). Arrows indicate coalesced rafts and PKC-θ. The arrowhead in (J–L) identifies a non-responding J.Vav1 cell.
None
Fig. 9. Functional redundancy among Vav family members in J.Vav1 cells. (A) TCR-induced tyrosine phosphorylation of Vav-2 and Vav-3. Cells were stimulated with OKT3 mAb, and immunoprecipitated Vav proteins were immunoblotted sequentially with α-pTyr mAb (upper panel), followed by either α-Vav-2 or α-Vav-3 antibody (lower panel). (B) Reconstitution of IL-2 promoter activation defect by Vav proteins. J.Vav1 cells were transiently co-transfected with the pIL2-luc reporter plasmid, together with the indicated FLAG-tagged Vav constructs. Cells were stimulated for 16 h and luciferase activities were quantified as RLU. The immunoblot shows the expression levels of the FLAG-tagged Vav protein in each sample.

References

    1. Abraham R.T. (2000) Mutant T cell lines as model systems for the dissection of T cell antigen receptor signaling pathways. Immunol. Res., 22, 95–117. - PubMed
    1. Anborgh P.H., Qian,X., Papageorge,A.G., Vass,W.C., DeClue,J.E. and Lowy,D.R. (1999) Ras-specific exchange factor GRF: oligomerization through its Dbl homology domain and calcium-dependent activation of Raf. Mol. Cell. Biol., 19, 4611–4622. - PMC - PubMed
    1. Astoul E., Edmunds,C., Cantrell,D.A. and Ward,S.G. (2001) Pl 3-K and T-cell activation: limitations of T-leukemic cell lines as signaling models. Trends Immunol., 22, 490–496. - PubMed
    1. Bi K., Tanaka,Y., Coudronniere,N., Sugie,K., Hong,S.J., van Stipdonk, M.J.B. and Altman,A. (2001) Antigen-induced translocation of PKC-θ to membrane rafts is required for T cell activation. Nat. Immunol., 2, 556–563. - PubMed
    1. Billadeau D.D., Mackie,S.M., Schoon,R.A. and Leibson,P.J. (2000) The Rho family guanine nucleotide exchange factor Vav-2 regulates the development of cell-mediated cytotoxicity. J. Exp. Med., 192, 381–392. - PMC - PubMed

Publication types

MeSH terms

Substances