

doi: 10.1084/jem.20020805.
A crucial role for the p110delta subunit of phosphatidylinositol 3-kinase in B cell development and activation
Affiliations
- PMID: 12235209
- PMCID: PMC2194055
- DOI: 10.1084/jem.20020805
Item in Clipboard
A crucial role for the p110delta subunit of phosphatidylinositol 3-kinase in B cell development and activation
J Exp Med.
.
Abstract
Mice lacking the p110delta catalytic subunit of phosphatidylinositol 3-kinase have reduced numbers of B1 and marginal zone B cells, reduced levels of serum immunoglobulins, respond poorly to immunization with type II thymus-independent antigen, and are defective in their primary and secondary responses to thymus-dependent antigen. p110delta(-/-) B cells proliferate poorly in response to B cell receptor (BCR) or CD40 signals in vitro, fail to activate protein kinase B, and are prone to apoptosis. p110delta function is required for BCR-mediated calcium flux, activation of phosphlipaseCgamma2, and Bruton's tyrosine kinase. Thus, p110delta plays a critical role in B cell homeostasis and function.
Figures
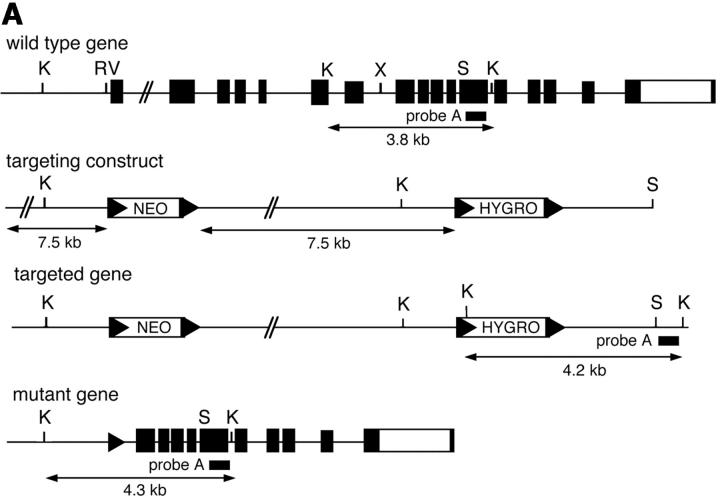
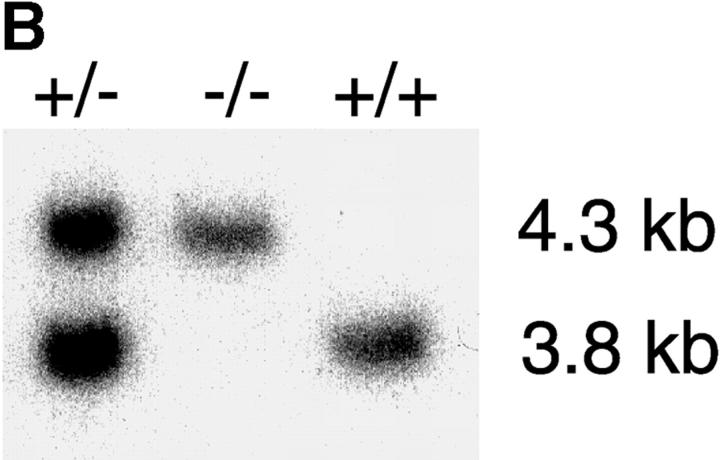
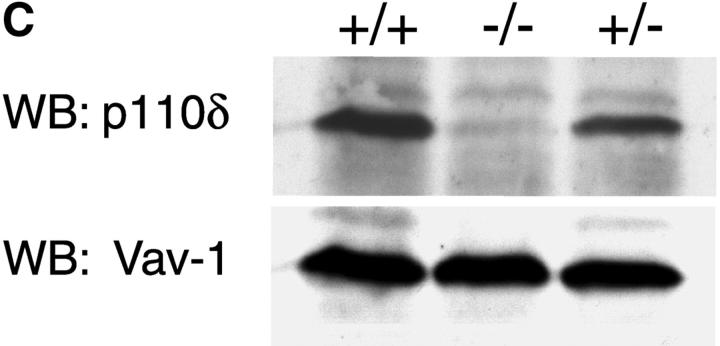
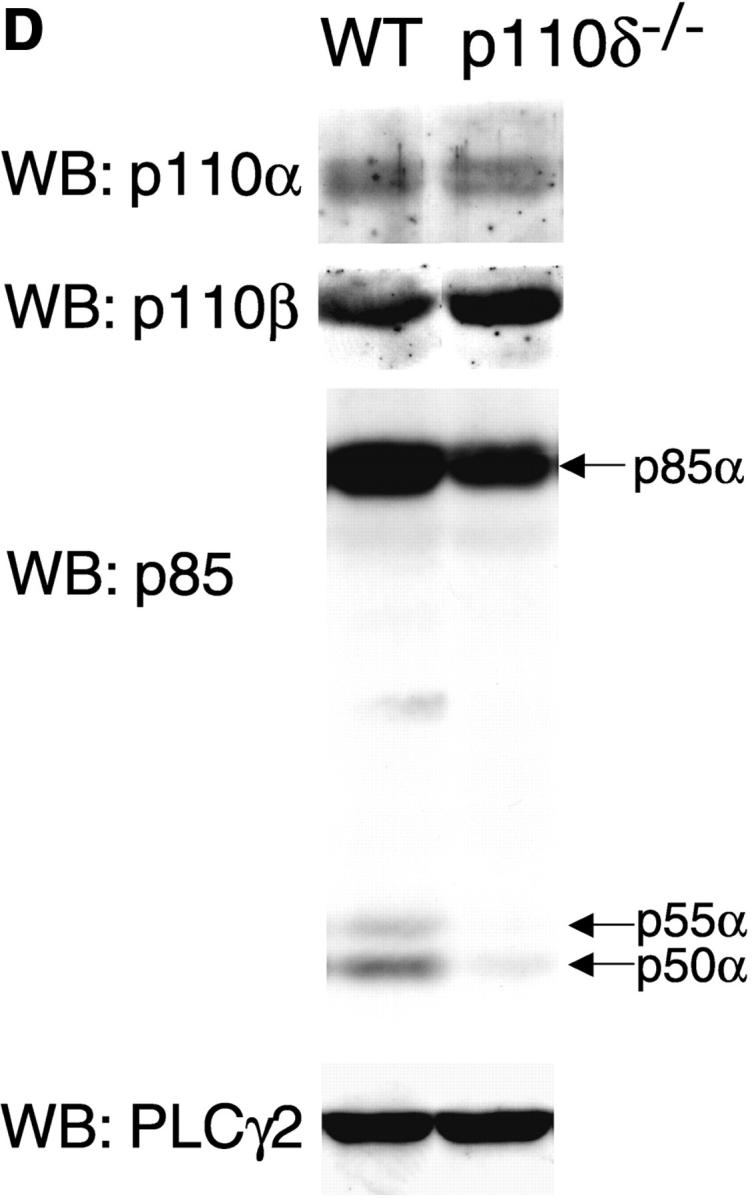
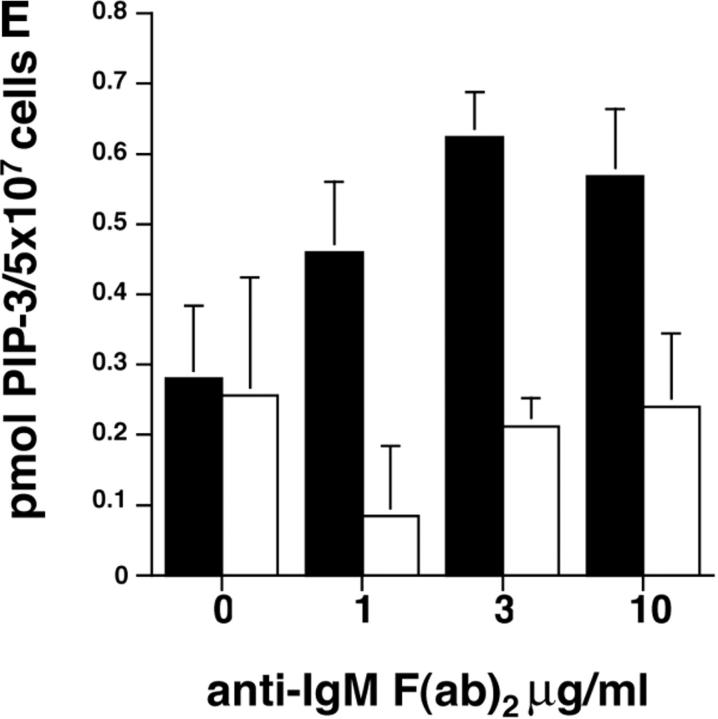
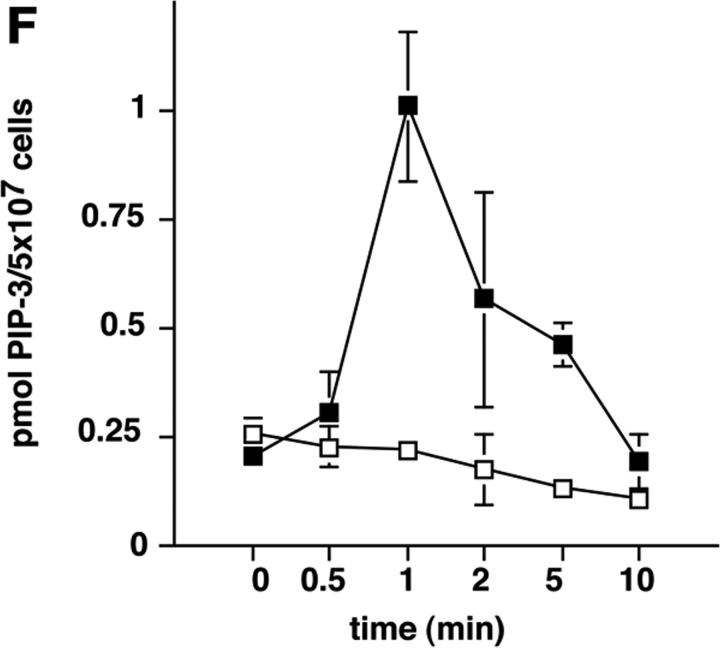
p110δ mutant B cells fail to produce PIP-3. (A) Gene targeting strategy. (B) Southern blot analysis of tail DNA from wild-type (+/+), heterozygous (+/−), and homozygous (−/−) mutant mice using probe A. (C) Western blot analysis of wild-type, heterozygous, and homozygous mutant thymocytes using antibody against p110δ. The blot was reprobed with anti–Vav-1 to demonstrate equal protein loading. (D) Western blot analysis of wild-type and homozygous mutant B-lymphocytes for levels of p110α, p110β, the p85/55/50α subunits of PI3-K, and PLCγ2. (E) BCR stimulated PIP-3 production in wild-type and mutant B cells. Wild-type is represented by black bars, mutant by white bars. (F) Time course of PIP-3 production in wild-type and mutant B cells stimulated with 10 μg/ml anti-IgM F(ab)2. In E and F, error bars represent the variance of triplicate determinations.
p110δ mutant B cells fail to produce PIP-3. (A) Gene targeting strategy. (B) Southern blot analysis of tail DNA from wild-type (+/+), heterozygous (+/−), and homozygous (−/−) mutant mice using probe A. (C) Western blot analysis of wild-type, heterozygous, and homozygous mutant thymocytes using antibody against p110δ. The blot was reprobed with anti–Vav-1 to demonstrate equal protein loading. (D) Western blot analysis of wild-type and homozygous mutant B-lymphocytes for levels of p110α, p110β, the p85/55/50α subunits of PI3-K, and PLCγ2. (E) BCR stimulated PIP-3 production in wild-type and mutant B cells. Wild-type is represented by black bars, mutant by white bars. (F) Time course of PIP-3 production in wild-type and mutant B cells stimulated with 10 μg/ml anti-IgM F(ab)2. In E and F, error bars represent the variance of triplicate determinations.
p110δ mutant B cells fail to produce PIP-3. (A) Gene targeting strategy. (B) Southern blot analysis of tail DNA from wild-type (+/+), heterozygous (+/−), and homozygous (−/−) mutant mice using probe A. (C) Western blot analysis of wild-type, heterozygous, and homozygous mutant thymocytes using antibody against p110δ. The blot was reprobed with anti–Vav-1 to demonstrate equal protein loading. (D) Western blot analysis of wild-type and homozygous mutant B-lymphocytes for levels of p110α, p110β, the p85/55/50α subunits of PI3-K, and PLCγ2. (E) BCR stimulated PIP-3 production in wild-type and mutant B cells. Wild-type is represented by black bars, mutant by white bars. (F) Time course of PIP-3 production in wild-type and mutant B cells stimulated with 10 μg/ml anti-IgM F(ab)2. In E and F, error bars represent the variance of triplicate determinations.
p110δ mutant B cells fail to produce PIP-3. (A) Gene targeting strategy. (B) Southern blot analysis of tail DNA from wild-type (+/+), heterozygous (+/−), and homozygous (−/−) mutant mice using probe A. (C) Western blot analysis of wild-type, heterozygous, and homozygous mutant thymocytes using antibody against p110δ. The blot was reprobed with anti–Vav-1 to demonstrate equal protein loading. (D) Western blot analysis of wild-type and homozygous mutant B-lymphocytes for levels of p110α, p110β, the p85/55/50α subunits of PI3-K, and PLCγ2. (E) BCR stimulated PIP-3 production in wild-type and mutant B cells. Wild-type is represented by black bars, mutant by white bars. (F) Time course of PIP-3 production in wild-type and mutant B cells stimulated with 10 μg/ml anti-IgM F(ab)2. In E and F, error bars represent the variance of triplicate determinations.
p110δ mutant B cells fail to produce PIP-3. (A) Gene targeting strategy. (B) Southern blot analysis of tail DNA from wild-type (+/+), heterozygous (+/−), and homozygous (−/−) mutant mice using probe A. (C) Western blot analysis of wild-type, heterozygous, and homozygous mutant thymocytes using antibody against p110δ. The blot was reprobed with anti–Vav-1 to demonstrate equal protein loading. (D) Western blot analysis of wild-type and homozygous mutant B-lymphocytes for levels of p110α, p110β, the p85/55/50α subunits of PI3-K, and PLCγ2. (E) BCR stimulated PIP-3 production in wild-type and mutant B cells. Wild-type is represented by black bars, mutant by white bars. (F) Time course of PIP-3 production in wild-type and mutant B cells stimulated with 10 μg/ml anti-IgM F(ab)2. In E and F, error bars represent the variance of triplicate determinations.
p110δ mutant B cells fail to produce PIP-3. (A) Gene targeting strategy. (B) Southern blot analysis of tail DNA from wild-type (+/+), heterozygous (+/−), and homozygous (−/−) mutant mice using probe A. (C) Western blot analysis of wild-type, heterozygous, and homozygous mutant thymocytes using antibody against p110δ. The blot was reprobed with anti–Vav-1 to demonstrate equal protein loading. (D) Western blot analysis of wild-type and homozygous mutant B-lymphocytes for levels of p110α, p110β, the p85/55/50α subunits of PI3-K, and PLCγ2. (E) BCR stimulated PIP-3 production in wild-type and mutant B cells. Wild-type is represented by black bars, mutant by white bars. (F) Time course of PIP-3 production in wild-type and mutant B cells stimulated with 10 μg/ml anti-IgM F(ab)2. In E and F, error bars represent the variance of triplicate determinations.
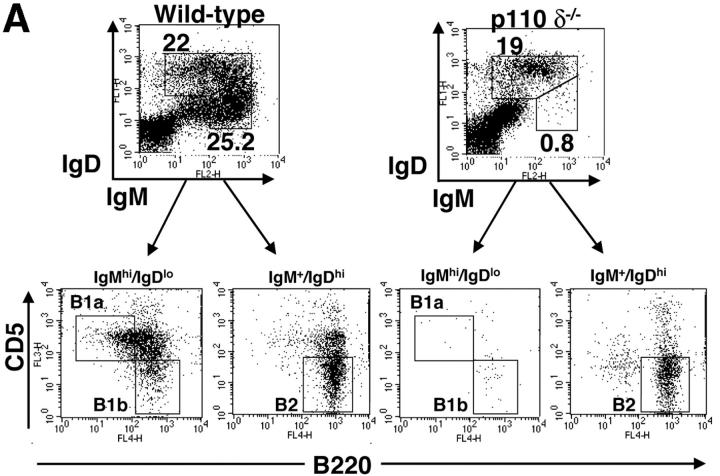
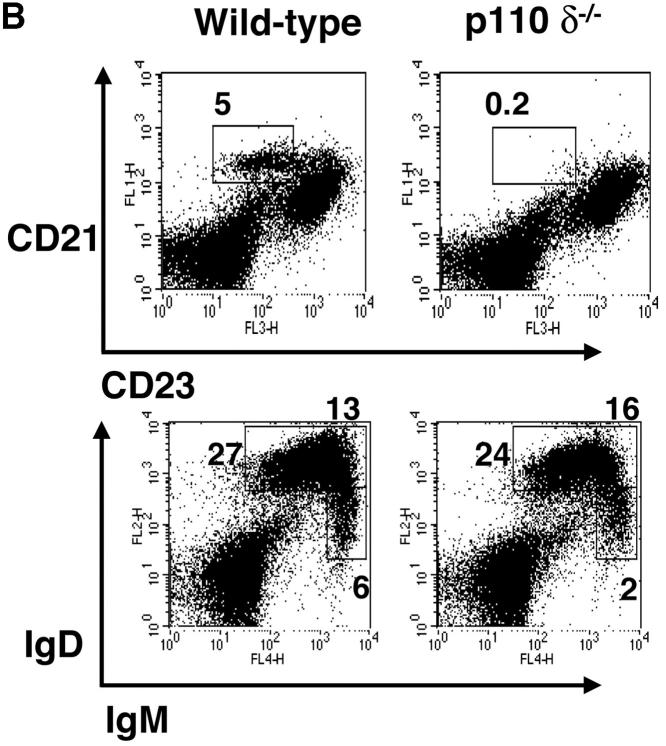
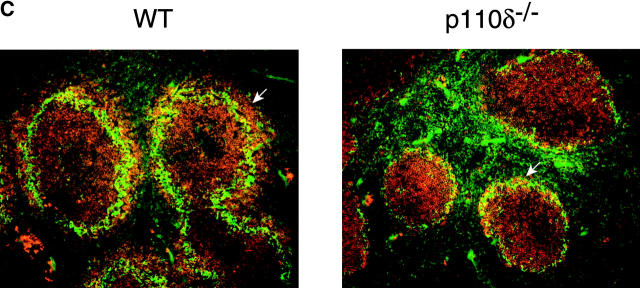
Lack of B1 and MZ B cells. (A) FACS® plot of scatter gated peritoneal cells stained with the indicated combinations of monoclonal antibodies. The gates in the top panel were used to generate the plots in the bottom panels which reveal the B1a, B1b, and B2 subsets. A proportion of B cells in the wild–type are B220high CD5+, which are also missing in the mutant. (B) Splenic cells were stained with the indicated combinations of mAbs to reveal MZ and follicular B cell profiles. Numbers indicate the percentage of lymphocytes falling within the gate. These gates were used to calculate the numbers of cells in Table I. (C) Immunofluorescence performed on splenic cryosections using MOMA-1 (green) and anti-IgM (red) revealed a marked reduction in MZ B cells in p110δ−/− mice (right). The position of MZ B cells is arrowed. The results shown are representative of four mutant spleens examined. Original magnification: 200×.
Lack of B1 and MZ B cells. (A) FACS® plot of scatter gated peritoneal cells stained with the indicated combinations of monoclonal antibodies. The gates in the top panel were used to generate the plots in the bottom panels which reveal the B1a, B1b, and B2 subsets. A proportion of B cells in the wild–type are B220high CD5+, which are also missing in the mutant. (B) Splenic cells were stained with the indicated combinations of mAbs to reveal MZ and follicular B cell profiles. Numbers indicate the percentage of lymphocytes falling within the gate. These gates were used to calculate the numbers of cells in Table I. (C) Immunofluorescence performed on splenic cryosections using MOMA-1 (green) and anti-IgM (red) revealed a marked reduction in MZ B cells in p110δ−/− mice (right). The position of MZ B cells is arrowed. The results shown are representative of four mutant spleens examined. Original magnification: 200×.
Lack of B1 and MZ B cells. (A) FACS® plot of scatter gated peritoneal cells stained with the indicated combinations of monoclonal antibodies. The gates in the top panel were used to generate the plots in the bottom panels which reveal the B1a, B1b, and B2 subsets. A proportion of B cells in the wild–type are B220high CD5+, which are also missing in the mutant. (B) Splenic cells were stained with the indicated combinations of mAbs to reveal MZ and follicular B cell profiles. Numbers indicate the percentage of lymphocytes falling within the gate. These gates were used to calculate the numbers of cells in Table I. (C) Immunofluorescence performed on splenic cryosections using MOMA-1 (green) and anti-IgM (red) revealed a marked reduction in MZ B cells in p110δ−/− mice (right). The position of MZ B cells is arrowed. The results shown are representative of four mutant spleens examined. Original magnification: 200×.
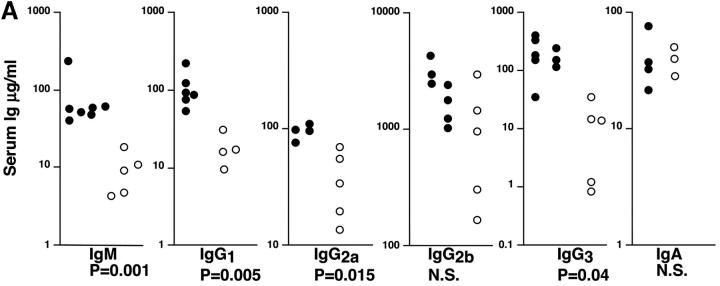
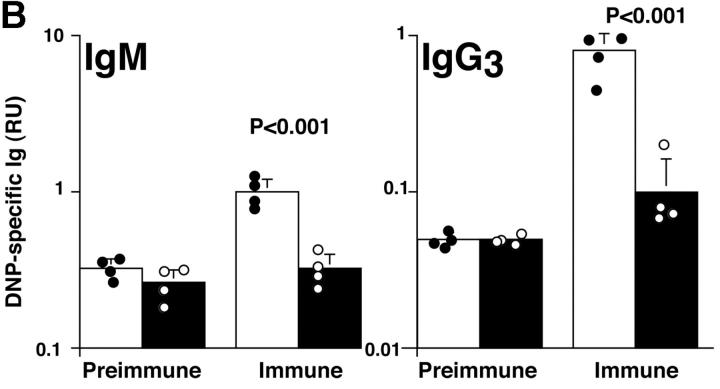
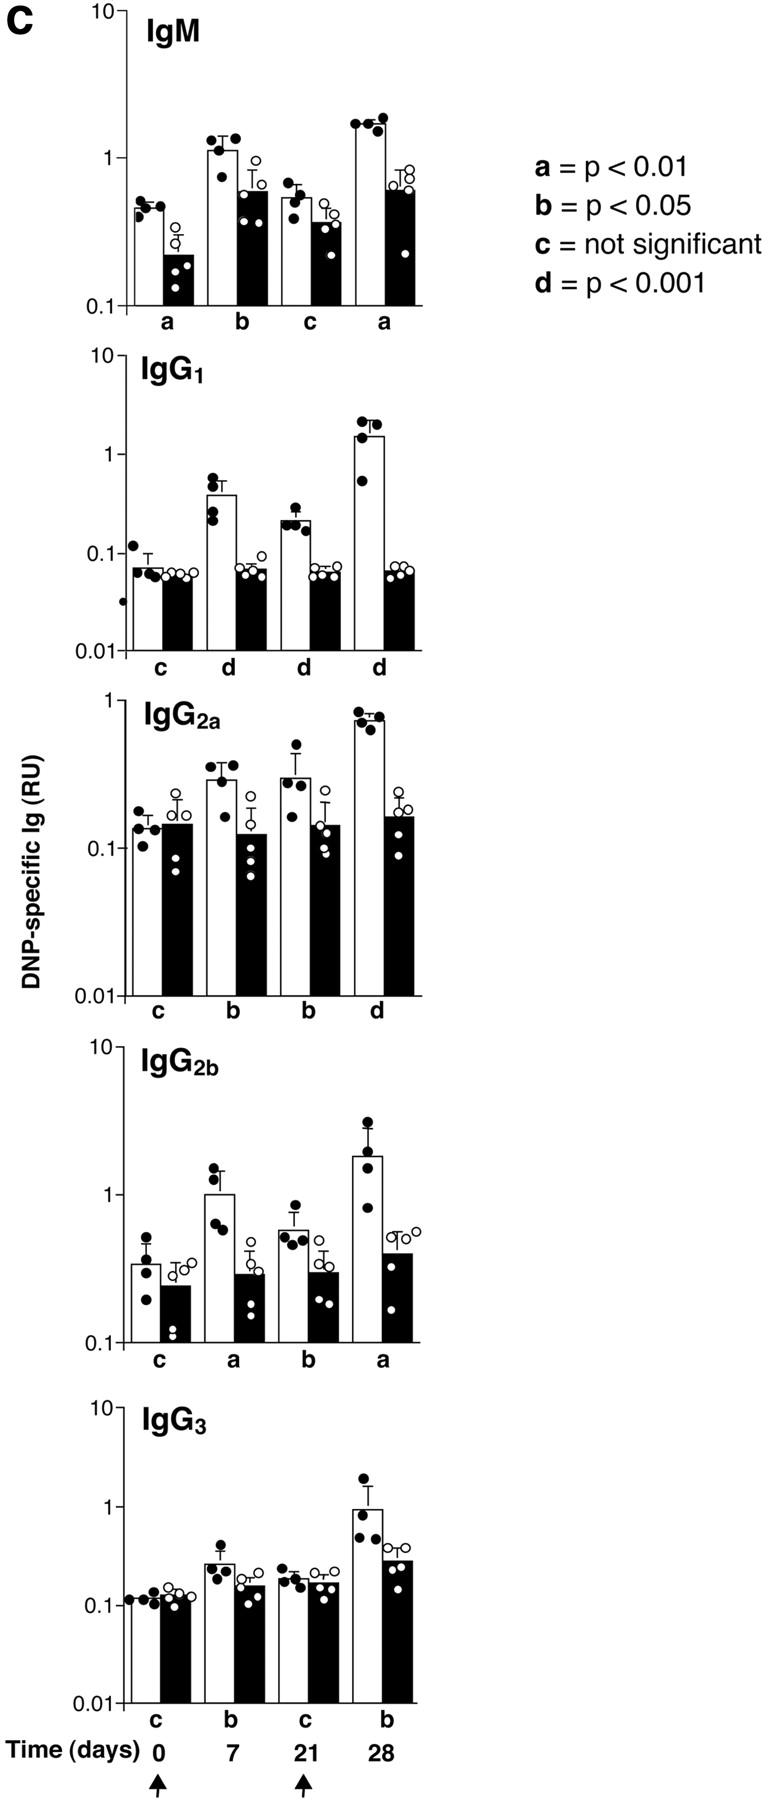
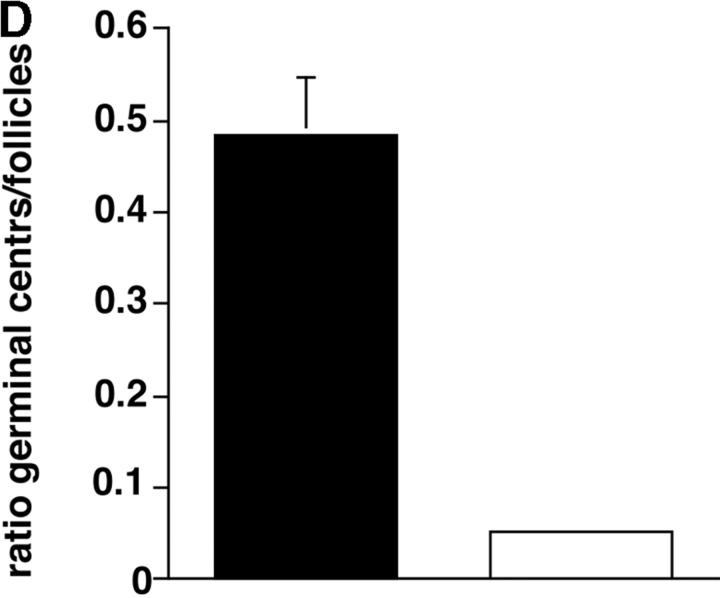
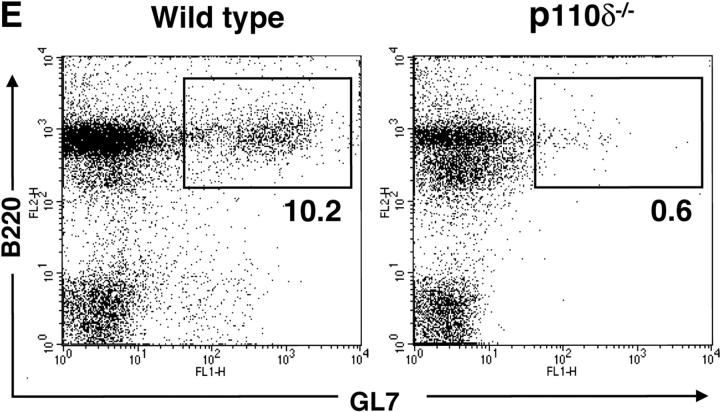
Immune function in p110δ mutant mice. (A) Serum Ig levels in naive mice were measured by ELISA. (B) DNP-specific Ig of the indicated isotypes were determined by ELISA of “preimmune” collected before immunization, and “immune” sera collected 7 d after immunization with DNP-Ficoll. (C) DNP-specific Ig was measured in preimmune serum, and in serum taken 7 and 21 d after immunization with DNP-KLH. Mice were then reimmunized at 21 d and bled 7 d later to measure the secondary response. In each set of graphs, the relative unit (absorbance) value for individual control animals is represented by a filled circle, individual p110δ-deficient mice are represented by open circles. Bars represent the average and SD for the group. In the TD responses, arrows represent the points at which mice were immunized (days 1 and 21). P values denote the levels of significance between sera of control and p110δ−/− mice as determined by the Student's t test. a, P < 0.01; b, P < 0.05; c, not significant; d, P < 0.001. (D) Quantitation of germinal center formation in spleens taken 10 d after immunization. The results are expressed as the ratio of PNA+ germinal centers/B220+ follicles. Black bar, wild type; white bar, mutant. Data was compiled from two control mice and four mutant mice. (E) Flow cytometric analysis of lymphocytes from Peyer's patches. Activated B cells are gated as B220+ GL7+, the numbers refer to the percentage of lymphocytes falling within the indicated gate.
Immune function in p110δ mutant mice. (A) Serum Ig levels in naive mice were measured by ELISA. (B) DNP-specific Ig of the indicated isotypes were determined by ELISA of “preimmune” collected before immunization, and “immune” sera collected 7 d after immunization with DNP-Ficoll. (C) DNP-specific Ig was measured in preimmune serum, and in serum taken 7 and 21 d after immunization with DNP-KLH. Mice were then reimmunized at 21 d and bled 7 d later to measure the secondary response. In each set of graphs, the relative unit (absorbance) value for individual control animals is represented by a filled circle, individual p110δ-deficient mice are represented by open circles. Bars represent the average and SD for the group. In the TD responses, arrows represent the points at which mice were immunized (days 1 and 21). P values denote the levels of significance between sera of control and p110δ−/− mice as determined by the Student's t test. a, P < 0.01; b, P < 0.05; c, not significant; d, P < 0.001. (D) Quantitation of germinal center formation in spleens taken 10 d after immunization. The results are expressed as the ratio of PNA+ germinal centers/B220+ follicles. Black bar, wild type; white bar, mutant. Data was compiled from two control mice and four mutant mice. (E) Flow cytometric analysis of lymphocytes from Peyer's patches. Activated B cells are gated as B220+ GL7+, the numbers refer to the percentage of lymphocytes falling within the indicated gate.
Immune function in p110δ mutant mice. (A) Serum Ig levels in naive mice were measured by ELISA. (B) DNP-specific Ig of the indicated isotypes were determined by ELISA of “preimmune” collected before immunization, and “immune” sera collected 7 d after immunization with DNP-Ficoll. (C) DNP-specific Ig was measured in preimmune serum, and in serum taken 7 and 21 d after immunization with DNP-KLH. Mice were then reimmunized at 21 d and bled 7 d later to measure the secondary response. In each set of graphs, the relative unit (absorbance) value for individual control animals is represented by a filled circle, individual p110δ-deficient mice are represented by open circles. Bars represent the average and SD for the group. In the TD responses, arrows represent the points at which mice were immunized (days 1 and 21). P values denote the levels of significance between sera of control and p110δ−/− mice as determined by the Student's t test. a, P < 0.01; b, P < 0.05; c, not significant; d, P < 0.001. (D) Quantitation of germinal center formation in spleens taken 10 d after immunization. The results are expressed as the ratio of PNA+ germinal centers/B220+ follicles. Black bar, wild type; white bar, mutant. Data was compiled from two control mice and four mutant mice. (E) Flow cytometric analysis of lymphocytes from Peyer's patches. Activated B cells are gated as B220+ GL7+, the numbers refer to the percentage of lymphocytes falling within the indicated gate.
Immune function in p110δ mutant mice. (A) Serum Ig levels in naive mice were measured by ELISA. (B) DNP-specific Ig of the indicated isotypes were determined by ELISA of “preimmune” collected before immunization, and “immune” sera collected 7 d after immunization with DNP-Ficoll. (C) DNP-specific Ig was measured in preimmune serum, and in serum taken 7 and 21 d after immunization with DNP-KLH. Mice were then reimmunized at 21 d and bled 7 d later to measure the secondary response. In each set of graphs, the relative unit (absorbance) value for individual control animals is represented by a filled circle, individual p110δ-deficient mice are represented by open circles. Bars represent the average and SD for the group. In the TD responses, arrows represent the points at which mice were immunized (days 1 and 21). P values denote the levels of significance between sera of control and p110δ−/− mice as determined by the Student's t test. a, P < 0.01; b, P < 0.05; c, not significant; d, P < 0.001. (D) Quantitation of germinal center formation in spleens taken 10 d after immunization. The results are expressed as the ratio of PNA+ germinal centers/B220+ follicles. Black bar, wild type; white bar, mutant. Data was compiled from two control mice and four mutant mice. (E) Flow cytometric analysis of lymphocytes from Peyer's patches. Activated B cells are gated as B220+ GL7+, the numbers refer to the percentage of lymphocytes falling within the indicated gate.
Immune function in p110δ mutant mice. (A) Serum Ig levels in naive mice were measured by ELISA. (B) DNP-specific Ig of the indicated isotypes were determined by ELISA of “preimmune” collected before immunization, and “immune” sera collected 7 d after immunization with DNP-Ficoll. (C) DNP-specific Ig was measured in preimmune serum, and in serum taken 7 and 21 d after immunization with DNP-KLH. Mice were then reimmunized at 21 d and bled 7 d later to measure the secondary response. In each set of graphs, the relative unit (absorbance) value for individual control animals is represented by a filled circle, individual p110δ-deficient mice are represented by open circles. Bars represent the average and SD for the group. In the TD responses, arrows represent the points at which mice were immunized (days 1 and 21). P values denote the levels of significance between sera of control and p110δ−/− mice as determined by the Student's t test. a, P < 0.01; b, P < 0.05; c, not significant; d, P < 0.001. (D) Quantitation of germinal center formation in spleens taken 10 d after immunization. The results are expressed as the ratio of PNA+ germinal centers/B220+ follicles. Black bar, wild type; white bar, mutant. Data was compiled from two control mice and four mutant mice. (E) Flow cytometric analysis of lymphocytes from Peyer's patches. Activated B cells are gated as B220+ GL7+, the numbers refer to the percentage of lymphocytes falling within the indicated gate.
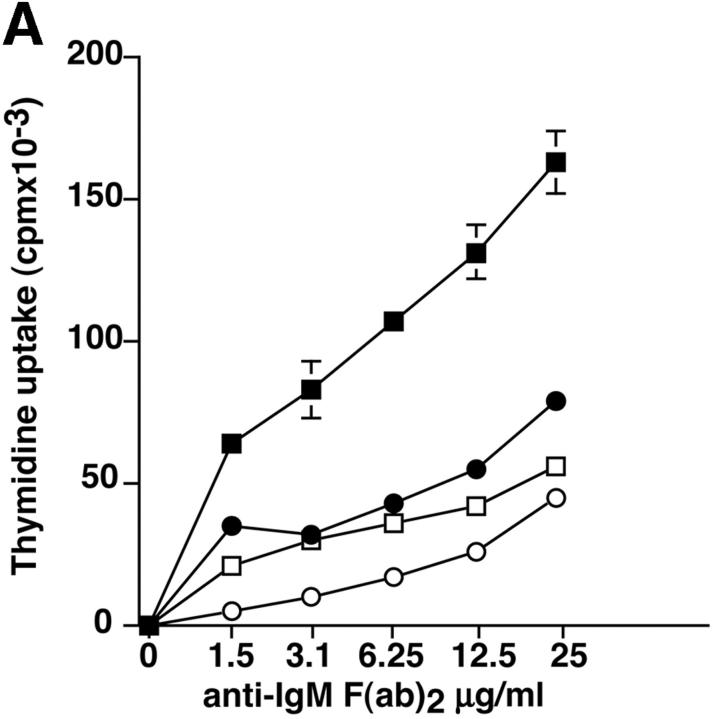
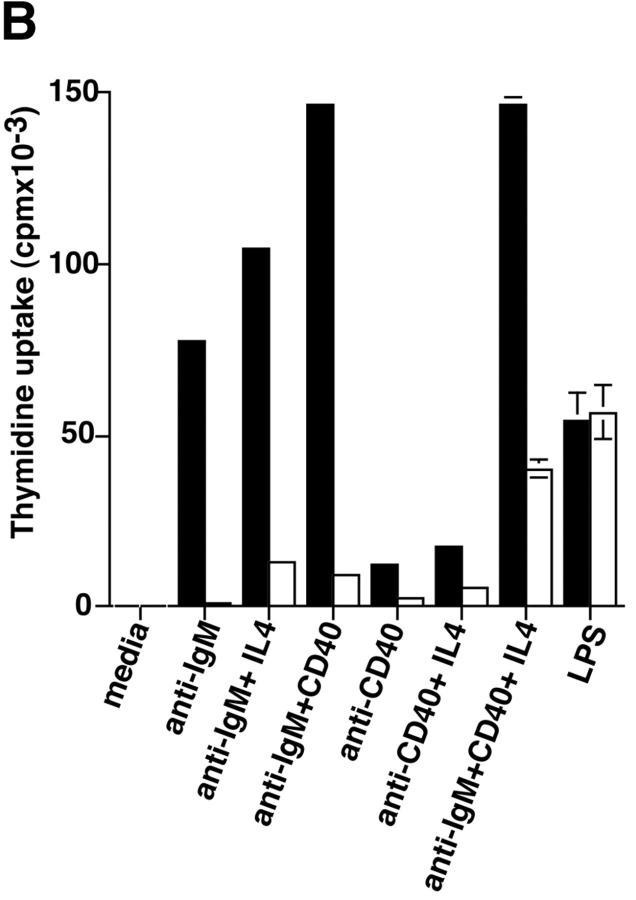
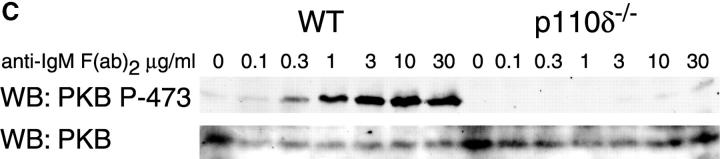
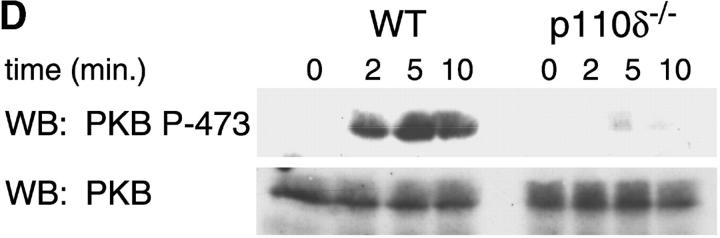
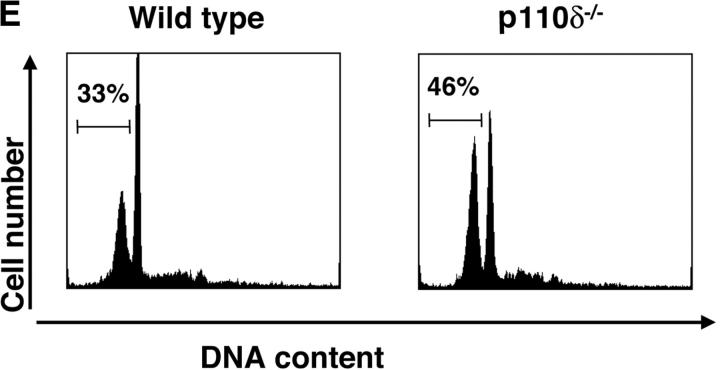
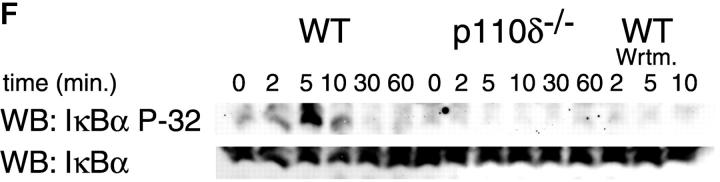
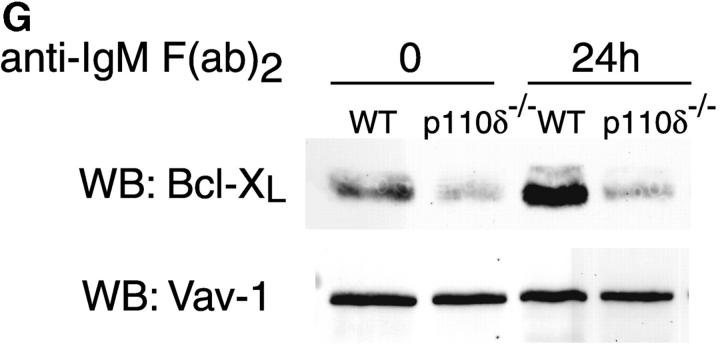
Proliferation and apoptosis of p110δ−/− B cells. (A) Purified splenic B cells were cultured for 72 h with the indicated doses of polyclonal F(ab)2 goat anti–mouse IgM with (squares) and without (circles) 100 U/ml recombinant murine IL-4. (B) B cells were cultured for 72 h with media alone, or the indicated combinations of 6.25 μg/ml monoclonal anti-IgM (clone B7.6), 6.25 μg/ml monoclonal anti-CD40 (clone 3/23), and 100 U/ml recombinant murine IL-4. Control B cells are the black symbols, mutant B cells the white symbols. The numbers presented for each group represent counts per minute (cpm) plotted as mean and SD. (C) Purified B cells were stimulated with the indicated amounts of F(ab)2 goat anti–mouse IgM for 2 min and lysed in SDS-PAGE sample buffer. Western blots were developed with antibodies specific for PKB phosphorylated on serine 473 then stripped and reprobed with a pan-PKB antibody (Cell Signaling Technology). (D) Time course of PKB phosphorylation on serine 473 after stimulation with 10 μg/ml F(ab)2 goat anti–mouse IgM. (E) B cells were cultured for 24 h in RPMI 1640 plus 10% serum and apoptotic cells identified by flow cytometric analysis of DNA content using propidium iodide staining. Data are representative of B cells from three mice of each genotype. (F) Defective IκBα serine 32 phosphorylation, B cells were stimulated as in D and whole cell lysates blotted with phosphospecific antibody, top panel, the blot was then stripped and reprobed with antibody to IκBα. On the right-hand side of the panel wild-type B-lymphocytes were treated with 100 nM wortmannin (Wrtm.) before stimulation. (G) Bcl-xL levels were determined in freshly isolated B cells and in B cells that had been stimulated for 24 h with 20 μg/ml F(ab)2 goat anti–mouse IgM.
Proliferation and apoptosis of p110δ−/− B cells. (A) Purified splenic B cells were cultured for 72 h with the indicated doses of polyclonal F(ab)2 goat anti–mouse IgM with (squares) and without (circles) 100 U/ml recombinant murine IL-4. (B) B cells were cultured for 72 h with media alone, or the indicated combinations of 6.25 μg/ml monoclonal anti-IgM (clone B7.6), 6.25 μg/ml monoclonal anti-CD40 (clone 3/23), and 100 U/ml recombinant murine IL-4. Control B cells are the black symbols, mutant B cells the white symbols. The numbers presented for each group represent counts per minute (cpm) plotted as mean and SD. (C) Purified B cells were stimulated with the indicated amounts of F(ab)2 goat anti–mouse IgM for 2 min and lysed in SDS-PAGE sample buffer. Western blots were developed with antibodies specific for PKB phosphorylated on serine 473 then stripped and reprobed with a pan-PKB antibody (Cell Signaling Technology). (D) Time course of PKB phosphorylation on serine 473 after stimulation with 10 μg/ml F(ab)2 goat anti–mouse IgM. (E) B cells were cultured for 24 h in RPMI 1640 plus 10% serum and apoptotic cells identified by flow cytometric analysis of DNA content using propidium iodide staining. Data are representative of B cells from three mice of each genotype. (F) Defective IκBα serine 32 phosphorylation, B cells were stimulated as in D and whole cell lysates blotted with phosphospecific antibody, top panel, the blot was then stripped and reprobed with antibody to IκBα. On the right-hand side of the panel wild-type B-lymphocytes were treated with 100 nM wortmannin (Wrtm.) before stimulation. (G) Bcl-xL levels were determined in freshly isolated B cells and in B cells that had been stimulated for 24 h with 20 μg/ml F(ab)2 goat anti–mouse IgM.
Proliferation and apoptosis of p110δ−/− B cells. (A) Purified splenic B cells were cultured for 72 h with the indicated doses of polyclonal F(ab)2 goat anti–mouse IgM with (squares) and without (circles) 100 U/ml recombinant murine IL-4. (B) B cells were cultured for 72 h with media alone, or the indicated combinations of 6.25 μg/ml monoclonal anti-IgM (clone B7.6), 6.25 μg/ml monoclonal anti-CD40 (clone 3/23), and 100 U/ml recombinant murine IL-4. Control B cells are the black symbols, mutant B cells the white symbols. The numbers presented for each group represent counts per minute (cpm) plotted as mean and SD. (C) Purified B cells were stimulated with the indicated amounts of F(ab)2 goat anti–mouse IgM for 2 min and lysed in SDS-PAGE sample buffer. Western blots were developed with antibodies specific for PKB phosphorylated on serine 473 then stripped and reprobed with a pan-PKB antibody (Cell Signaling Technology). (D) Time course of PKB phosphorylation on serine 473 after stimulation with 10 μg/ml F(ab)2 goat anti–mouse IgM. (E) B cells were cultured for 24 h in RPMI 1640 plus 10% serum and apoptotic cells identified by flow cytometric analysis of DNA content using propidium iodide staining. Data are representative of B cells from three mice of each genotype. (F) Defective IκBα serine 32 phosphorylation, B cells were stimulated as in D and whole cell lysates blotted with phosphospecific antibody, top panel, the blot was then stripped and reprobed with antibody to IκBα. On the right-hand side of the panel wild-type B-lymphocytes were treated with 100 nM wortmannin (Wrtm.) before stimulation. (G) Bcl-xL levels were determined in freshly isolated B cells and in B cells that had been stimulated for 24 h with 20 μg/ml F(ab)2 goat anti–mouse IgM.
Proliferation and apoptosis of p110δ−/− B cells. (A) Purified splenic B cells were cultured for 72 h with the indicated doses of polyclonal F(ab)2 goat anti–mouse IgM with (squares) and without (circles) 100 U/ml recombinant murine IL-4. (B) B cells were cultured for 72 h with media alone, or the indicated combinations of 6.25 μg/ml monoclonal anti-IgM (clone B7.6), 6.25 μg/ml monoclonal anti-CD40 (clone 3/23), and 100 U/ml recombinant murine IL-4. Control B cells are the black symbols, mutant B cells the white symbols. The numbers presented for each group represent counts per minute (cpm) plotted as mean and SD. (C) Purified B cells were stimulated with the indicated amounts of F(ab)2 goat anti–mouse IgM for 2 min and lysed in SDS-PAGE sample buffer. Western blots were developed with antibodies specific for PKB phosphorylated on serine 473 then stripped and reprobed with a pan-PKB antibody (Cell Signaling Technology). (D) Time course of PKB phosphorylation on serine 473 after stimulation with 10 μg/ml F(ab)2 goat anti–mouse IgM. (E) B cells were cultured for 24 h in RPMI 1640 plus 10% serum and apoptotic cells identified by flow cytometric analysis of DNA content using propidium iodide staining. Data are representative of B cells from three mice of each genotype. (F) Defective IκBα serine 32 phosphorylation, B cells were stimulated as in D and whole cell lysates blotted with phosphospecific antibody, top panel, the blot was then stripped and reprobed with antibody to IκBα. On the right-hand side of the panel wild-type B-lymphocytes were treated with 100 nM wortmannin (Wrtm.) before stimulation. (G) Bcl-xL levels were determined in freshly isolated B cells and in B cells that had been stimulated for 24 h with 20 μg/ml F(ab)2 goat anti–mouse IgM.
Proliferation and apoptosis of p110δ−/− B cells. (A) Purified splenic B cells were cultured for 72 h with the indicated doses of polyclonal F(ab)2 goat anti–mouse IgM with (squares) and without (circles) 100 U/ml recombinant murine IL-4. (B) B cells were cultured for 72 h with media alone, or the indicated combinations of 6.25 μg/ml monoclonal anti-IgM (clone B7.6), 6.25 μg/ml monoclonal anti-CD40 (clone 3/23), and 100 U/ml recombinant murine IL-4. Control B cells are the black symbols, mutant B cells the white symbols. The numbers presented for each group represent counts per minute (cpm) plotted as mean and SD. (C) Purified B cells were stimulated with the indicated amounts of F(ab)2 goat anti–mouse IgM for 2 min and lysed in SDS-PAGE sample buffer. Western blots were developed with antibodies specific for PKB phosphorylated on serine 473 then stripped and reprobed with a pan-PKB antibody (Cell Signaling Technology). (D) Time course of PKB phosphorylation on serine 473 after stimulation with 10 μg/ml F(ab)2 goat anti–mouse IgM. (E) B cells were cultured for 24 h in RPMI 1640 plus 10% serum and apoptotic cells identified by flow cytometric analysis of DNA content using propidium iodide staining. Data are representative of B cells from three mice of each genotype. (F) Defective IκBα serine 32 phosphorylation, B cells were stimulated as in D and whole cell lysates blotted with phosphospecific antibody, top panel, the blot was then stripped and reprobed with antibody to IκBα. On the right-hand side of the panel wild-type B-lymphocytes were treated with 100 nM wortmannin (Wrtm.) before stimulation. (G) Bcl-xL levels were determined in freshly isolated B cells and in B cells that had been stimulated for 24 h with 20 μg/ml F(ab)2 goat anti–mouse IgM.
Proliferation and apoptosis of p110δ−/− B cells. (A) Purified splenic B cells were cultured for 72 h with the indicated doses of polyclonal F(ab)2 goat anti–mouse IgM with (squares) and without (circles) 100 U/ml recombinant murine IL-4. (B) B cells were cultured for 72 h with media alone, or the indicated combinations of 6.25 μg/ml monoclonal anti-IgM (clone B7.6), 6.25 μg/ml monoclonal anti-CD40 (clone 3/23), and 100 U/ml recombinant murine IL-4. Control B cells are the black symbols, mutant B cells the white symbols. The numbers presented for each group represent counts per minute (cpm) plotted as mean and SD. (C) Purified B cells were stimulated with the indicated amounts of F(ab)2 goat anti–mouse IgM for 2 min and lysed in SDS-PAGE sample buffer. Western blots were developed with antibodies specific for PKB phosphorylated on serine 473 then stripped and reprobed with a pan-PKB antibody (Cell Signaling Technology). (D) Time course of PKB phosphorylation on serine 473 after stimulation with 10 μg/ml F(ab)2 goat anti–mouse IgM. (E) B cells were cultured for 24 h in RPMI 1640 plus 10% serum and apoptotic cells identified by flow cytometric analysis of DNA content using propidium iodide staining. Data are representative of B cells from three mice of each genotype. (F) Defective IκBα serine 32 phosphorylation, B cells were stimulated as in D and whole cell lysates blotted with phosphospecific antibody, top panel, the blot was then stripped and reprobed with antibody to IκBα. On the right-hand side of the panel wild-type B-lymphocytes were treated with 100 nM wortmannin (Wrtm.) before stimulation. (G) Bcl-xL levels were determined in freshly isolated B cells and in B cells that had been stimulated for 24 h with 20 μg/ml F(ab)2 goat anti–mouse IgM.
Proliferation and apoptosis of p110δ−/− B cells. (A) Purified splenic B cells were cultured for 72 h with the indicated doses of polyclonal F(ab)2 goat anti–mouse IgM with (squares) and without (circles) 100 U/ml recombinant murine IL-4. (B) B cells were cultured for 72 h with media alone, or the indicated combinations of 6.25 μg/ml monoclonal anti-IgM (clone B7.6), 6.25 μg/ml monoclonal anti-CD40 (clone 3/23), and 100 U/ml recombinant murine IL-4. Control B cells are the black symbols, mutant B cells the white symbols. The numbers presented for each group represent counts per minute (cpm) plotted as mean and SD. (C) Purified B cells were stimulated with the indicated amounts of F(ab)2 goat anti–mouse IgM for 2 min and lysed in SDS-PAGE sample buffer. Western blots were developed with antibodies specific for PKB phosphorylated on serine 473 then stripped and reprobed with a pan-PKB antibody (Cell Signaling Technology). (D) Time course of PKB phosphorylation on serine 473 after stimulation with 10 μg/ml F(ab)2 goat anti–mouse IgM. (E) B cells were cultured for 24 h in RPMI 1640 plus 10% serum and apoptotic cells identified by flow cytometric analysis of DNA content using propidium iodide staining. Data are representative of B cells from three mice of each genotype. (F) Defective IκBα serine 32 phosphorylation, B cells were stimulated as in D and whole cell lysates blotted with phosphospecific antibody, top panel, the blot was then stripped and reprobed with antibody to IκBα. On the right-hand side of the panel wild-type B-lymphocytes were treated with 100 nM wortmannin (Wrtm.) before stimulation. (G) Bcl-xL levels were determined in freshly isolated B cells and in B cells that had been stimulated for 24 h with 20 μg/ml F(ab)2 goat anti–mouse IgM.
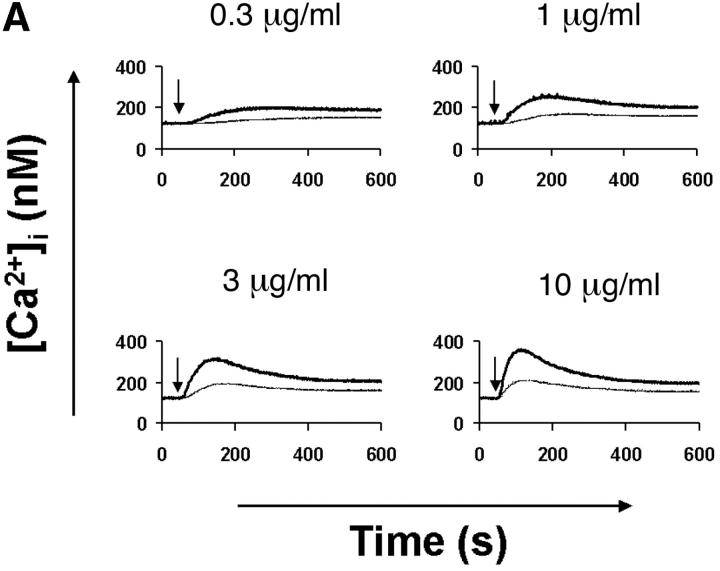
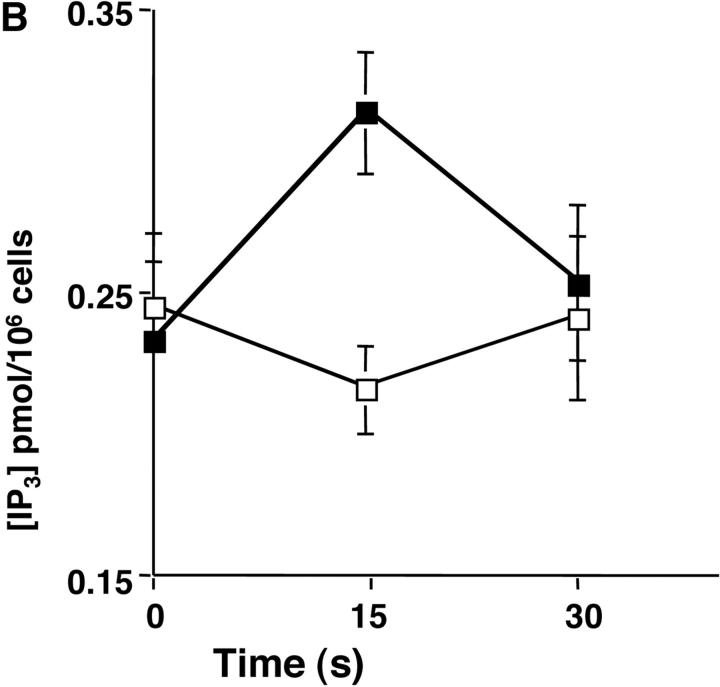
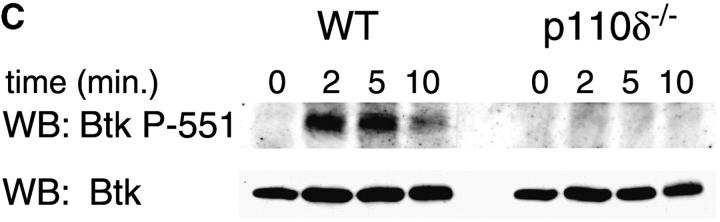
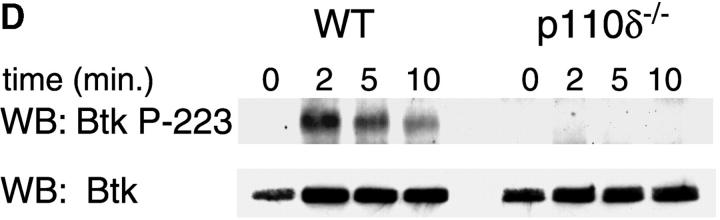
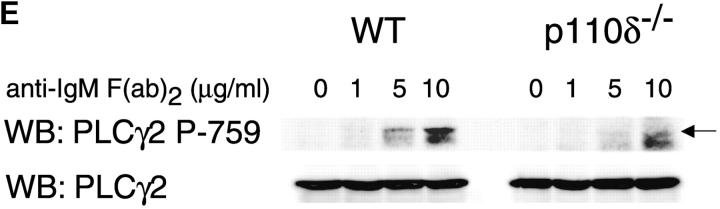
Defective calcium signaling pathway in p110δ−/− B cells. (A) Intracellular calcium concentration in B cells after addition of F(ab)2 goat anti–mouse IgM, (indicated by arrow). Wild-type is thick black line and mutant thin line. (B) IP3 production was measured in control (black symbol) and mutant (white symbol) B cells after stimulation with 33 μg/ml F(ab)2 goat anti–mouse IgM using a kit purchased from New England Nuclear. The values represent the mean and SD of determinations from B cells from four individual mice. (C and D) Purified B cells were stimulated with 10 μg/ml F(ab)2 goat anti–mouse IgM for the indicated times and Btk immunoprecipitates blotted with antibodies specific for phosphorylated tyrosine 551 (C) or 223 (D). Blots were stripped and reprobed with polyclonal anti-Btk to demonstrate equal recovery of proteins. (E) Defective phosphorylation of PLCγ2. Whole cell lysates from purified B cells stimulated for 1 min with the indicated amounts of F(ab)2 goat anti–mouse IgM were blotted with antibody specific to phosphorylated tyrosine residue 759 of PLCγ2. The blot was then stripped and reprobed with antisera specific to PLCγ2 to confirm loading. The arrow indicates the position of phospho-PLCγ2.
Defective calcium signaling pathway in p110δ−/− B cells. (A) Intracellular calcium concentration in B cells after addition of F(ab)2 goat anti–mouse IgM, (indicated by arrow). Wild-type is thick black line and mutant thin line. (B) IP3 production was measured in control (black symbol) and mutant (white symbol) B cells after stimulation with 33 μg/ml F(ab)2 goat anti–mouse IgM using a kit purchased from New England Nuclear. The values represent the mean and SD of determinations from B cells from four individual mice. (C and D) Purified B cells were stimulated with 10 μg/ml F(ab)2 goat anti–mouse IgM for the indicated times and Btk immunoprecipitates blotted with antibodies specific for phosphorylated tyrosine 551 (C) or 223 (D). Blots were stripped and reprobed with polyclonal anti-Btk to demonstrate equal recovery of proteins. (E) Defective phosphorylation of PLCγ2. Whole cell lysates from purified B cells stimulated for 1 min with the indicated amounts of F(ab)2 goat anti–mouse IgM were blotted with antibody specific to phosphorylated tyrosine residue 759 of PLCγ2. The blot was then stripped and reprobed with antisera specific to PLCγ2 to confirm loading. The arrow indicates the position of phospho-PLCγ2.
Defective calcium signaling pathway in p110δ−/− B cells. (A) Intracellular calcium concentration in B cells after addition of F(ab)2 goat anti–mouse IgM, (indicated by arrow). Wild-type is thick black line and mutant thin line. (B) IP3 production was measured in control (black symbol) and mutant (white symbol) B cells after stimulation with 33 μg/ml F(ab)2 goat anti–mouse IgM using a kit purchased from New England Nuclear. The values represent the mean and SD of determinations from B cells from four individual mice. (C and D) Purified B cells were stimulated with 10 μg/ml F(ab)2 goat anti–mouse IgM for the indicated times and Btk immunoprecipitates blotted with antibodies specific for phosphorylated tyrosine 551 (C) or 223 (D). Blots were stripped and reprobed with polyclonal anti-Btk to demonstrate equal recovery of proteins. (E) Defective phosphorylation of PLCγ2. Whole cell lysates from purified B cells stimulated for 1 min with the indicated amounts of F(ab)2 goat anti–mouse IgM were blotted with antibody specific to phosphorylated tyrosine residue 759 of PLCγ2. The blot was then stripped and reprobed with antisera specific to PLCγ2 to confirm loading. The arrow indicates the position of phospho-PLCγ2.
Defective calcium signaling pathway in p110δ−/− B cells. (A) Intracellular calcium concentration in B cells after addition of F(ab)2 goat anti–mouse IgM, (indicated by arrow). Wild-type is thick black line and mutant thin line. (B) IP3 production was measured in control (black symbol) and mutant (white symbol) B cells after stimulation with 33 μg/ml F(ab)2 goat anti–mouse IgM using a kit purchased from New England Nuclear. The values represent the mean and SD of determinations from B cells from four individual mice. (C and D) Purified B cells were stimulated with 10 μg/ml F(ab)2 goat anti–mouse IgM for the indicated times and Btk immunoprecipitates blotted with antibodies specific for phosphorylated tyrosine 551 (C) or 223 (D). Blots were stripped and reprobed with polyclonal anti-Btk to demonstrate equal recovery of proteins. (E) Defective phosphorylation of PLCγ2. Whole cell lysates from purified B cells stimulated for 1 min with the indicated amounts of F(ab)2 goat anti–mouse IgM were blotted with antibody specific to phosphorylated tyrosine residue 759 of PLCγ2. The blot was then stripped and reprobed with antisera specific to PLCγ2 to confirm loading. The arrow indicates the position of phospho-PLCγ2.
Defective calcium signaling pathway in p110δ−/− B cells. (A) Intracellular calcium concentration in B cells after addition of F(ab)2 goat anti–mouse IgM, (indicated by arrow). Wild-type is thick black line and mutant thin line. (B) IP3 production was measured in control (black symbol) and mutant (white symbol) B cells after stimulation with 33 μg/ml F(ab)2 goat anti–mouse IgM using a kit purchased from New England Nuclear. The values represent the mean and SD of determinations from B cells from four individual mice. (C and D) Purified B cells were stimulated with 10 μg/ml F(ab)2 goat anti–mouse IgM for the indicated times and Btk immunoprecipitates blotted with antibodies specific for phosphorylated tyrosine 551 (C) or 223 (D). Blots were stripped and reprobed with polyclonal anti-Btk to demonstrate equal recovery of proteins. (E) Defective phosphorylation of PLCγ2. Whole cell lysates from purified B cells stimulated for 1 min with the indicated amounts of F(ab)2 goat anti–mouse IgM were blotted with antibody specific to phosphorylated tyrosine residue 759 of PLCγ2. The blot was then stripped and reprobed with antisera specific to PLCγ2 to confirm loading. The arrow indicates the position of phospho-PLCγ2.
References
-
- Meffre, E., R. Casellas, and M.C. Nussenzweig. 2000. Antibody regulation of B cell development. Nat. Immunol. 1:379–385. - PubMed
-
- Craxton, A., K.L. Otipoby, A. Jiang, and E.A. Clark. 1999. Signal transduction pathways that regulate the fate of B lymphocytes. Adv. Immunol. 73:79–152. - PubMed
-
- Gold, M.R., V.W. Chan, C.W. Turck, and A.L. DeFranco. 1992. Membrane Ig cross-linking regulates phosphatidylinositol 3-kinase in B lymphocytes. J. Immunol. 148:2012–2022. - PubMed
-
- Yamanashi, Y., Y. Fukui, B. Wongsasant, Y. Kinoshita, Y. Ichimori, K. Toyoshima, and T. Yamamoto. 1992. Activation of Src-like protein-tyrosine kinase Lyn and its association with phosphatidylinositol 3-kinase upon B-cell antigen receptor-mediated signaling. Proc. Natl. Acad. Sci. USA. 89:1118–1122. - PMC - PubMed
-
- Tuveson, D.A., R.H. Carter, S.P. Soltoff, and D.T. Fearon. 1993. CD19 of B cells as a surrogate kinase insert region to bind phosphatidylinositol 3-kinase. Science. 260:986–989. - PubMed
Publication types
MeSH terms
Substances
LinkOut - more resources
Full Text Sources
Other Literature Sources
Molecular Biology Databases
Research Materials
