. 2002 Sep 15;30(18):3936-44.
doi: 10.1093/nar/gkf518.

Interaction of the ocr gene 0.3 protein of bacteriophage T7 with EcoKI restriction/modification enzyme

Affiliations

Interaction of the ocr gene 0.3 protein of bacteriophage T7 with EcoKI restriction/modification enzyme

C Atanasiu et al. Nucleic Acids Res. .

Abstract

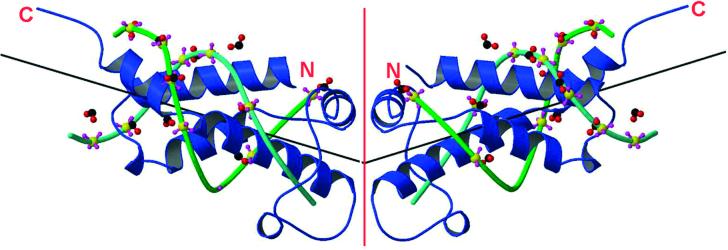
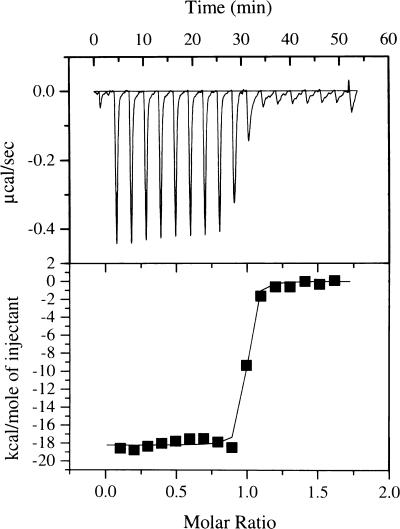
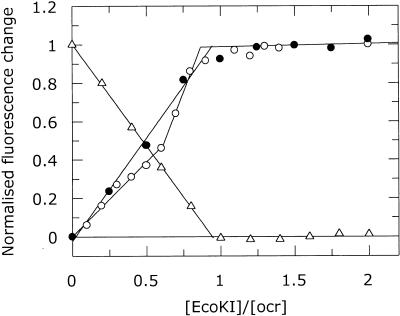
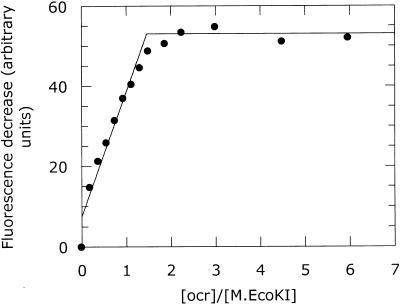
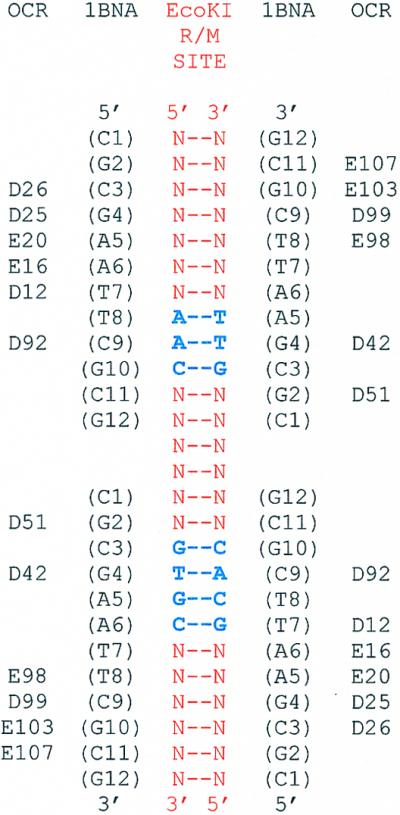
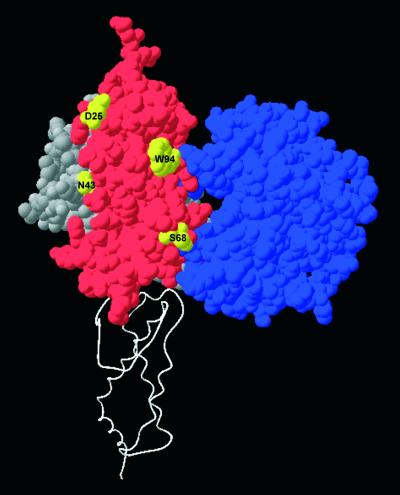
The ocr protein, the product of gene 0.3 of bacteriophage T7, is a structural mimic of the phosphate backbone of B-form DNA. In total it mimics 22 phosphate groups over approximately 24 bp of DNA. This mimicry allows it to block DNA binding by type I DNA restriction enzymes and to inhibit these enzymes. We have determined that multiple ocr dimers can bind stoichiometrically to the archetypal type I enzyme, EcoKI. One dimer binds to the core methyltransferase and two to the complete bifunctional restriction and modification enzyme. Ocr can also bind to the component subunits of EcoKI. Binding affinity to the methyltransferase core is extremely strong with a large favourable enthalpy change and an unfavourable entropy change. This strong interaction prevents the dissociation of the methyltransferase which occurs upon dilution of the enzyme. This stabilisation arises because the interaction appears to involve virtually the entire surface area of ocr and leads to the enzyme completely wrapping around ocr.


Figures

Figure 1
Figure 1
Superimposition of two 12 bp B-DNA molecules on the ocr dimer adapted from Walkinshaw et al. (1). Ocr is shown in blue ribbon form with N- and C-termini indicated and the dimer interface shown as a red line. A fit of phosphate groups of a B-DNA complex (1,42) onto 11 carboxyl groups of ocr gave an r.m.s. fit of 1.9 Å. Phosphate groups are coloured yellow (phosphorus) and purple (oxygen). The carboxyl groups are coloured red (oxygen) and black (carbon). The sugar backbones of the DNA chains are coloured in two shades of green with the base pairs omitted for clarity. Vectors for the DNA helical axes are drawn as black lines.
Figure 2
Figure 2
ITC titration curve for the addition of ocr to M.EcoKI (upper). The lower panel shows the calorimetric binding isotherm for the ocr–M.EcoKI system. The x-axis in both panels shows the molar ratio of ocr to M.EcoKI. The theoretical fit in the lower panel is for a ΔH of –76.3 kJ mol–1 and 0.95 ocr dimers per M.EcoKI.
Figure 3
Figure 3
Typical fluorescence emission changes from ocr(Cys) mutant proteins labelled with AEDANS or PM upon titration of M.EcoKI. Ocr(N4C)–AEDANS (open circle), ocr(N43C)–AEDANS (filled circle) and ocr(D62C)–PM (open triangle). The stoichiometric end-points for these titrations are given in Table 1.
Figure 4
Figure 4
Change in tryptophan emission intensity at 340 nm for the titration of M.EcoKI with ocr. The change in fluorescence is calculated from the sum of the fluorescence of the individual components minus the fluorescence observed from the mixture of the components. The stoichiometric end-point for this titration is given in Table 1.
Figure 5
Figure 5
Binding of M.EcoKI and R.EcoKI to fluorescein-labelled forms of ocr(N43C) and ocr(S68C) quenches the fluorescence of the label. Ocr(N43C) with M.EcoKI (filled circle) and R.EcoKI (cross) and ocr(S68C) with M.EcoKI (open circle) and R.EcoKI (open square).
Figure 6
Figure 6
HPLC gel filtration of M.EcoKI (filled circle), ocr (open triangle) and complexes of ocr with M.EcoKI (open circle). The observed elution volumes have been converted to apparent molecular weight using a calibration curve. It is apparent that M.EcoKI dissociates with an apparent dissociation constant of 97 nM and that the addition of ocr prevents this process.
Figure 7
Figure 7
Quenching of AEDANS fluorescence emission by acrylamide. Quenching of AEDANS probe (cross), quenching of AEDANS from labelled ocr(Cys) mutant proteins (filled circles) and quenching from labelled ocr(Cys) proteins in the presence of M.EcoKI (open circles). Ocr(Cys) data are coloured as follows: ocr(N4C), black; ocr(D25C), red; ocr(N43C), orange; ocr(D62C), green; ocr(S68C), cyan; ocr(W94C), blue.
Figure 8
Figure 8
Change in tryptophan emission intensity at 340 nm upon the addition of ocr to R.EcoKI (filled circle), R subunit (open circle), M1S1 (filled triangle) and M subunit (open triangle). The change in fluorescence is calculated from the sum of the fluorescence of the individual components minus the fluorescence observed from the mixture of the components. The intensity change for R.EcoKI has been scaled by one-third. The stoichiometric end-points for these titrations are given in Table 1.
Figure 9
Figure 9
Alignment of ocr with the EcoKI DNA target. The EcoKI target is shown in bold blue letters within a red non-specific sequence. The amino acids in ocr are shown aligned with the nucleic acid sequence of the DNA strands shown in Figure 1 as defined in Walkinshaw et al. (1). The sequence of the DNA strands which are aligned with ocr is taken from the crystal structure 1BNA (42). The ocr and 1BNA sequences are aligned with the EcoKI sequence.
Figure 10
Figure 10
The target recognition domain of the S subunit, which binds to the DNA target sequence AAC (34), and the catalytic domain of the M subunit, which recognises the methylation state of this target, are shown in grey and blue space-filling representations, respectively. The ocr monomer shown in red is placed onto this partial model of EcoKI guided by the superimposition of DNA molecules derived from Figure 9. The second ocr monomer is shown as a white ribbon to define the orientation of ocr and EcoKI. Highlighted in yellow on the ocr monomer are mutation sites not covered by the modelled domains of EcoKI. These locations must be covered by other parts of EcoKI to explain the protection from acrylamide quenching when EcoKI is bound to ocr.

References

    1. Walkinshaw M.D., Taylor,P., Sturrock,S.S., Atanasiu,C., Berge,T., Henderson,R.M., Edwardson,J.M. and Dryden,D.T.F. (2002) Structure of Ocr from bacteriophage T7, a protein that mimics B-form DNA. Mol. Cell, 9, 187–194. - PubMed
    1. Kruger D.H. and Bickle,T.A. (1983) Bacteriophage survival: multiple mechanisms for avoiding the deoxyribonucleic acid restriction systems of their hosts. Microbiol. Rev., 47, 345–360. - PMC - PubMed
    1. Bickle T.A. and Kruger,D.H. (1993) Biology of DNA restriction. Microbiol. Rev., 57, 434–450. - PMC - PubMed
    1. Zavilgelsky G.B. (2000) Antirestriction. Mol. Biol. (Mosk.), 34, 854–862. - PubMed
    1. Studier F.W. (1975) Gene 0.3 of bacteriophage T7 acts to overcome the DNA restriction system of the host. J. Mol. Biol., 94, 283–295. - PubMed

Publication types

MeSH terms

Substances