. 2002 Oct 1;99(20):12795-800.
doi: 10.1073/pnas.162041399. Epub 2002 Sep 17.

Intrinsic and extrinsic contributions to stochasticity in gene expression

Affiliations

Intrinsic and extrinsic contributions to stochasticity in gene expression

Peter S Swain et al. Proc Natl Acad Sci U S A. .

Abstract

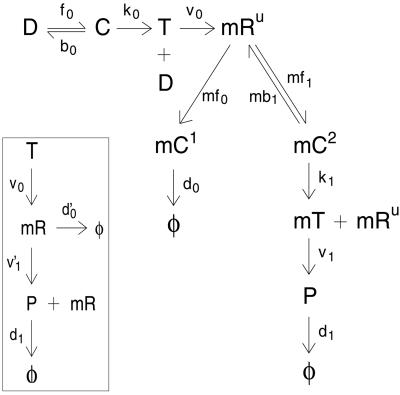
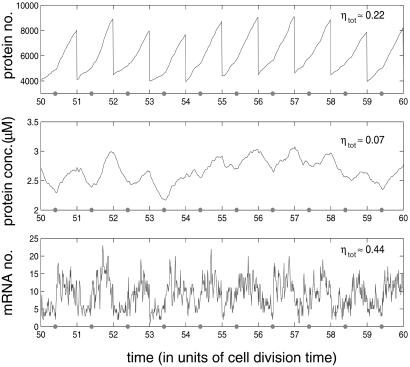
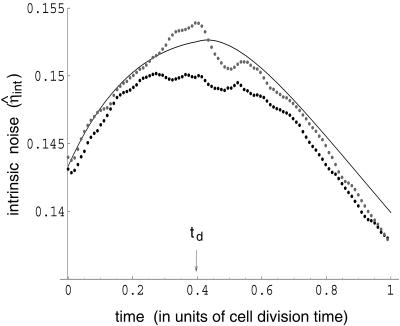
Gene expression is a stochastic, or "noisy," process. This noise comes about in two ways. The inherent stochasticity of biochemical processes such as transcription and translation generates "intrinsic" noise. In addition, fluctuations in the amounts or states of other cellular components lead indirectly to variation in the expression of a particular gene and thus represent "extrinsic" noise. Here, we show how the total variation in the level of expression of a given gene can be decomposed into its intrinsic and extrinsic components. We demonstrate theoretically that simultaneous measurement of two identical genes per cell enables discrimination of these two types of noise. Analytic expressions for intrinsic noise are given for a model that involves all the major steps in transcription and translation. These expressions give the sensitivity to various parameters, quantify the deviation from Poisson statistics, and provide a way of fitting experiment. Transcription dominates the intrinsic noise when the average number of proteins made per mRNA transcript is greater than approximately 2. Below this number, translational effects also become important. Gene replication and cell division, included in the model, cause protein numbers to tend to a limit cycle. We calculate a general form for the extrinsic noise and illustrate it with the particular case of a single fluctuating extrinsic variable-a repressor protein, which acts on the gene of interest. All results are confirmed by stochastic simulation using plausible parameters for Escherichia coli.


Figures

Figure 1
Figure 1
Reaction scheme detailing constitutive expression of a protein P. All molecular species shown are intrinsic variables. Transcription is modeled (15) as reversible binding of RNAP to promoter, D (rates f0 and b0). Isomerization from closed to open complex and initiation of transcription are approximated as a first-order process (rate k0). Only the leader region of the mRNA, mRU, is followed. It is made by transcribing polymerase, T, at rate ν0. mRNA is degraded by the binding of the degradosome (rate mf0) to form complex mC1, which decays in a first-order manner. Following ref. , ribosomes compete with degradosomes for the leader region of the mRNA and bind reversibly (rates mf1 and mb1). Start of translation is from the mC2 state with rate k1, which frees mRU for further binding. Protein is translated (rate ν1) in the mT state and decays with rate d1. Inset shows a simplified model of translation, with mR now designating an entire mRNA molecule, degrading at rate d0, and is translated with rate ν′1.
Figure 2
Figure 2
Simulation results for protein and mRNA number using the model of Fig. 1 Inset. A strong promoter is used (k0 = 0.1 s−1), and there is just one copy of the gene on the chromosome. On average, 15 proteins are synthesized per mRNA transcript, and the mRNA half-life is 1 min. Gene replication occurs every td = 0.4T into the cell cycle and is marked with a small dot on the time axis. All other parameters are given in the supporting information. The total noise ηtot is defined in Eqs. 6 and 7, with the overbar, in this simple case, just denoting a time (cell cycle) average. This is given for each species in the upper right-hand corner.
Figure 3
Figure 3
Comparison of analytic solution and stochastic simulation. The noise in protein level (averaged over 5,000 runs) for the three different models is plotted as a function of time (in units of the cell cycle). Upper light dotted curve is the result of a simulation of the full model of protein expression, Fig. 1, with k0 = 0.01 s−1. Dotted curve is a simulation of Fig. 1 Inset, whereas the full curve is a plot of Eq. 17. At the beginning of the cell cycle, η̂int is slightly greater than that at the end because of the random partitioning of proteins and mRNA into daughter cells on division.

References

    1. Guptasarma P. BioEssays. 1995;17:987–997. - PubMed
    1. Spudich J L, Koshland D E., Jr Nature (London) 1976;262:467–471. - PubMed
    1. McAdams H H, Arkin A. Trends Genet. 1999;15:65–69. - PubMed
    1. Arkin A, Ross J, McAdams H H. Genetics. 1998;149:1633–1648. - PMC - PubMed
    1. Ko M S H. J Theor Biol. 1991;153:181–194. - PubMed

Publication types

LinkOut - more resources