. 2002 Oct 1;99(20):12895-900.
doi: 10.1073/pnas.202483199. Epub 2002 Sep 17.

Quantitative imaging of cis-regulatory reporters in living embryos

Affiliations

Quantitative imaging of cis-regulatory reporters in living embryos

Ivan J Dmochowski et al. Proc Natl Acad Sci U S A. .

Abstract

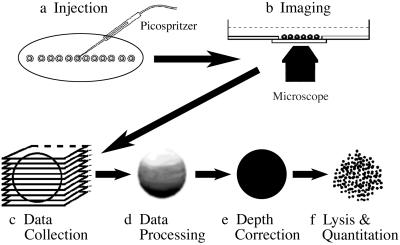
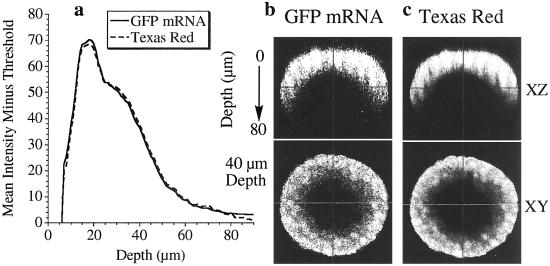
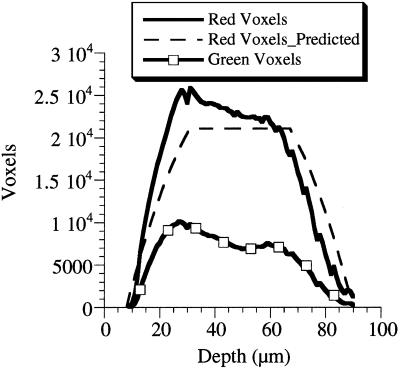
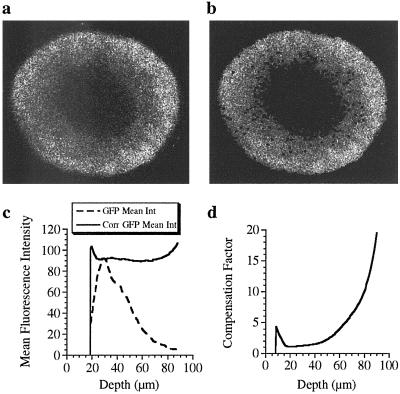
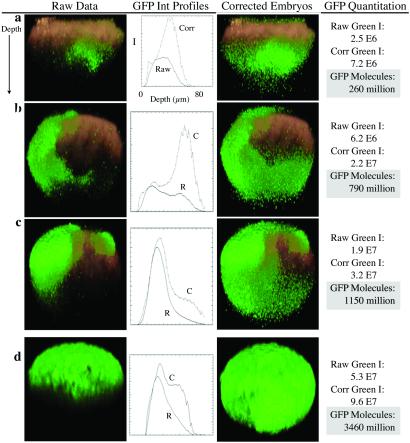
A confocal laser scanning microscopy method has been developed for the quantitation of green fluorescent protein (GFP) as a reporter of gene activity in living three-dimensional structures such as sea urchin and starfish embryos. This method is between 2 and 50 times more accurate than conventional confocal microscopy procedures depending on the localization of GFP within an embryo. By using coinjected Texas red dextran as an internal fluorescent standard, the observed GFP intensity is corrected for variations in laser excitation and fluorescence collection efficiency. To relate the recorded image intensity to the number of GFP molecules, the embryos were lysed gently, and a fluorometric analysis of their contents was performed. Confocal laser scanning microscopy data collection from a single sea urchin blastula required less than 2 min, thereby allowing gene expression in dozens of embryos to be monitored in parallel with high spatial and temporal resolution.


Figures

Figure 1
Figure 1
Method of GFP quantitation. (a) Microinjection of newly fertilized sea urchin embryos. Embryos first are rowed in a straight line onto a poly-L-lysine-coated coverslip. (b) Confocal microscopy at high magnification. (c) Collection of fluorescence data for both GFP and TR-labeled dextran throughout the embryo. (d) Input of data, showing large attenuation of signal with depth, into correction algorithms. (e) Output of depth-corrected fluorescence data showing considerable signal enhancement. (f) Lysis of the same Krox-GFP mRNA-injected embryos for GFP quantitation in solution using a fluorometer.
Figure 2
Figure 2
Depth profiles of GFP and TR evenly distributed throughout 18-hpf sea urchin embryos. (a) Overlaid plots of mean intensity (minus threshold) vs. depth for GFP and TR are virtually identical. (b) An XZ cross section through the embryo shows marked attenuation of GFP intensity in the bottom half of the embryo. An XY cross section (40-μm depth) shows fairly homogeneous GFP distribution in the embryo. (c) An XZ cross section also shows marked attenuation of TR intensity in the bottom half of the embryo. An XY cross section (40-μm depth) shows even TR distribution in the embryo.
Figure 3
Figure 3
Plot of voxels vs. depth (in micrometers) showing agreement between the distribution of filtered voxels and the shape of the embryo. Stray voxels have been removed by a linear threshold and 3 × 3 median filter. The TR voxel distribution with depth (solid line) closely matches calculated predictions (dashed line) based on a spherical 80-μm diameter sea urchin embryo with a central 36-μm diameter blastocoel. DNA (HE-GFP) is incorporated mosaically into cells, as shown by the more irregular GFP-voxel distribution (squares).
Figure 4
Figure 4
CLSM image showing TR fluorescence collected halfway (40 μm) through a living sea urchin embryo. (a) Raw data show considerable light scatter at both outer and inner (blastocoel) surfaces. (b) Data filtered by a linear threshold and 3 × 3 median filter show well defined edges. The red intensity threshold was found empirically to decrease linearly with depth: threshold = (2 × dark noise) + constant − (slope × slice). Under standard TR loading and imaging conditions, a constant equal to 16 and slope equal to 0.2 gave a discreet outer boundary with minimal loss of signal within the embryo. Thus, for the deepest slice (80 μm), the threshold for the red channel equaled twice the mean dark noise. (c) Plot of depth-corrected GFP mean intensity (Int) vs. depth (in micrometers). Homogeneous distribution of GFP throughout the embryo is not reflected in the raw data (green mean). Dividing the green mean by the depth profile (for TR) results in a linear distribution of GFP mean intensity with only minor edge effects at shallow and deep slices. (d) Plot of signal compensation vs. depth (in micrometers). The compensation factor, typically 20 at the deepest slice, is determined by dividing the corrected GFP intensity by the raw GFP intensity at each depth.
Figure 5
Figure 5
Depth-corrected three-dimensional image reconstructions of HE-GFP DNA-injected (ac) and Krox-GFP mRNA-injected (d) embryos. The embryos are not oriented on their animal–vegetal axis. Green voxels indicate areas of GFP expression. The boundaries of the embryo (shown in red) are delineated by TR. (ac) Mosaic HE-GFP expression in three different embryos. Data processing results in clear signal enhancement in the bottom third of the embryos. (d) Representative embryo showing Krox-GFP translation and resulting GFP distribution. Depth correction restores signal at deeper slices. GFP quantitation is possible for all embryos by using depth-corrected GFP fluorescence intensities. The calculated GFP can be compared with predictions based on measured rates of sea urchin protein synthesis (19, 20): 6 pl injected × 150 fg/pl mRNA = 900 fg = 9 × 10⁻¹³ g of mRNA; 9 × 10⁻¹³ g of mRNA/2.8 × 105 g/mol = 3.2 × 10⁻¹⁸ mol of mRNA; and 3.2 × 10−18 × (6.02 × 1023 molecules per mol) = 1.9 × 10⁶ mRNA molecules. mRNA translation rate = 140/h based on a spacing of 140 nucleotides per ribosome and a translational velocity of ≈1.8 codon⋅sec−1 at 15°C (19). Duration = 14 h, because GFP oxidation and chromophore formation take ≈4 h. Translation = (140/h) × 14 h = 1,960 GFPs per message at 18 h. 1,960 GFPs per mRNA × (1.9 × 10⁶ mRNA) = 3.7 × 10⁹ GFPs per embryo at 18 h. Predictions of GFP molecules in Krox-GFP-injected 18-hpf embryos represent an upper limit, because these calculations do not consider the degradation of mRNA or GFP.

References

    1. Ferrer-Martinez A, Gomez-Foix A M. BioTechniques. 2002;32:62–66. - PubMed
    1. Kam Z, Hanser B, Gustafsson M G L, Agard D A, Sedat J W. Proc Natl Acad Sci USA. 2001;98:3790–3795. - PMC - PubMed
    1. Davidson E H, Rast J P, Oliveri P, Ransick A, Calestani C, Yuh C-H, Minokawa T, Amore G, Hinman V, Arenas-Mena C, et al. Science. 2002;295:1669–1678. - PubMed
    1. Yuh C-H, Bolouri H, Davidson E H. Science. 1998;279:1896–1902. - PubMed
    1. Pawley J B, editor. Handbook of Biological Confocal Microscopy. New York: Plenum; 1995.

Publication types

LinkOut - more resources