. 2002 Oct;76(20):10099-108.
doi: 10.1128/jvi.76.20.10099-10108.2002.

Quantitation of human immunodeficiency virus type 1 DNA forms with the second template switch in peripheral blood cells predicts disease progression independently of plasma RNA load

Affiliations

Quantitation of human immunodeficiency virus type 1 DNA forms with the second template switch in peripheral blood cells predicts disease progression independently of plasma RNA load

Leondios G Kostrikis et al. J Virol. 2002 Oct.

Abstract

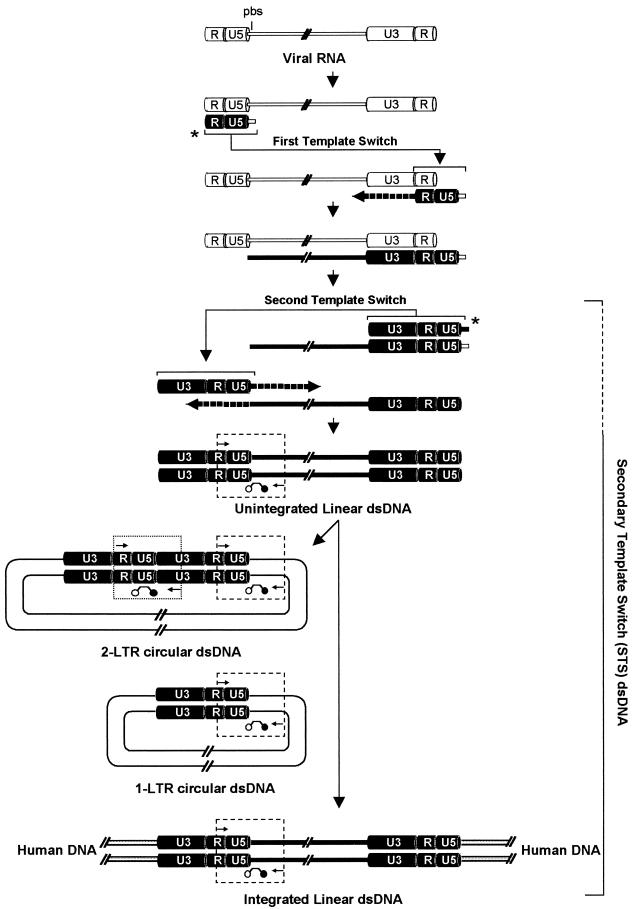
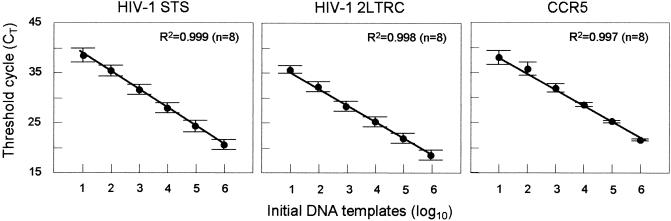
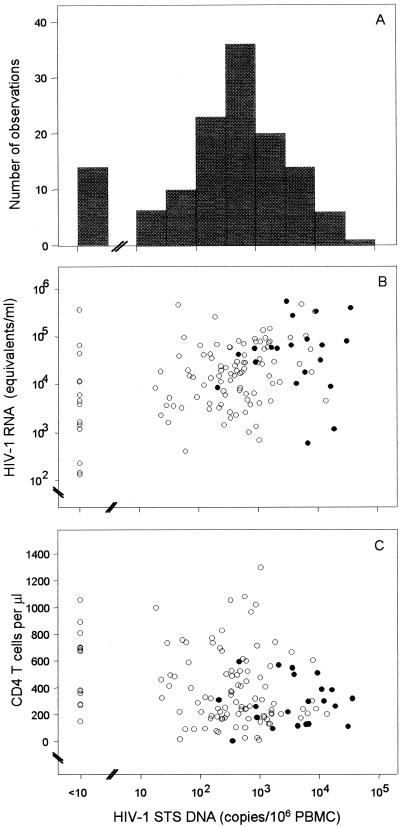
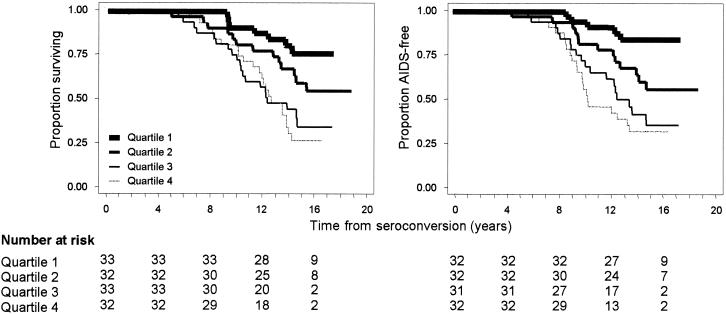
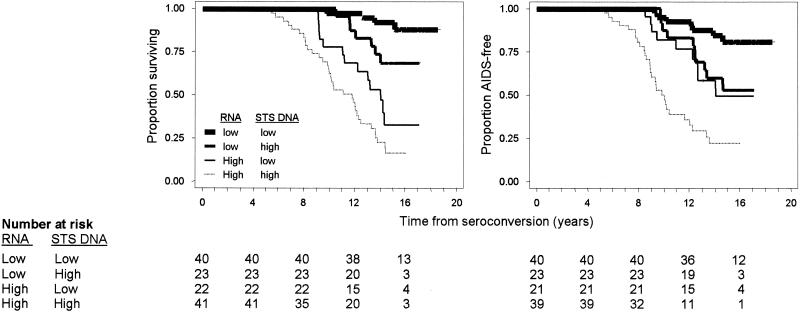
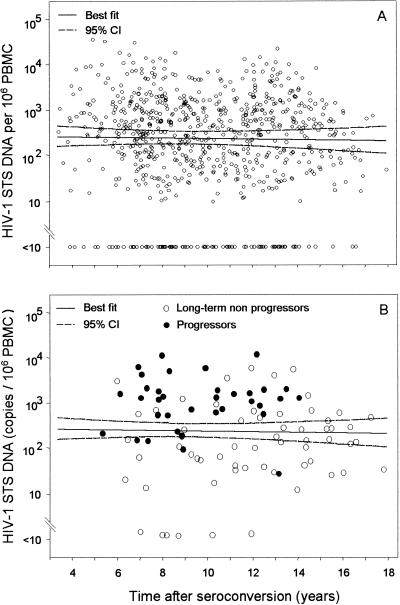
There are several forms of human immunodeficiency virus type 1 (HIV-1) DNA in peripheral blood T cells and lymph nodes in untreated HIV-1-infected individuals and in patients whose plasma HIV-1 RNA levels are suppressed by long-term combination antiretroviral therapy. However, it remains to be established whether the concentration of HIV-1 DNA in cells predicts the clinical outcome of HIV-1 infection. In this report, we measured the concentration of HIV-1 DNA forms which has undergone the second template switch (STS DNA) and 2-long-terminal-repeat DNA circles in peripheral blood mononuclear cell (PBMC) samples. To do this, we used molecular-beacon-based real-time PCR assays and studied 130 patients with hemophilia in the Multicenter Hemophilia Cohort Study. We assessed the influence of baseline HIV-1 STS DNA levels on the progression of HIV-1 disease in the absence of combination antiretroviral therapy by Kaplan-Meier and Cox regression analysis. Among the patients who progressed to AIDS, the median levels (interquartile ranges) of STS HIV-1 DNA in PBMC were significantly higher than those of patients who remained AIDS free during the 16 years of follow-up (1,017 [235 to 6,059] and 286 [31 to 732] copies per 10(6) PBMC, respectively; P < 0.0001). Rates of progression to death and development of AIDS varied significantly (log rank P < 0.001) by quartile distribution of HIV-1 STS DNA levels. After adjustment for age at seroconversion, baseline CD4(+) T-cell counts, plasma viral load, and T-cell-receptor excision circles, the relative hazards (RH) of death and AIDS were significantly increased with higher HIV-1 STS DNA levels (adjusted RH, 1.84 [95% confidence interval (CI), 1.30 to 2.59] and 2.62 [95% CI, 1.75 to 3.93] per 10-fold increase per 10(6) PBMC, respectively). HIV-1 STS DNA levels in each individual remained steady in longitudinal PBMC samples during 16 years of follow-up. Our findings show that the concentration of HIV-1 STS DNA in PBMC complements the HIV-1 RNA load in plasma in predicting the clinical outcome of HIV-1 disease. This parameter may have important implications for understanding the virological response to combination antiretroviral therapy.


Figures

FIG. 1.
FIG. 1.
Schematic representation summarizes the cellular HIV-1 intermediates formed during reverse transcription. U3, R, and U5 LTR regions are indicated on the 5′ and 3′ ends of the viral genome; solid line, viral gag, pol, and env genomic regions; pbs, primer-binding site; slashed lines, gaps in the HIV-1 genome. Arrowed lines marked by asterisks indicate the primary transfer of the R-U5 negative ssDNA from the 5′ end to the 3′ end of the RNA genome by complementarity between the R regions and the secondary transfer of the U3-R-U5-PBS positive ssDNA from the 3′ end to the 5′ end of the positive ssDNA viral genome by complementarity of the PBS region. Dashed arrows indicate the synthesis of positive and negative ssDNA to form a full-length dsDNA. In the nucleus, some linear dsDNA molecules, by following the integration pathway, are successfully integrated into the human genome, and some are circularized to LTRC and 2LTRC. Viral sequences bound by PCR primers and molecular beacons represent the amplicons used in STS DNA- and 2LTRC-specific molecular-beacon-based real-time PCR assays (enclosed by dashed and dotted boxes, respectively). The pool of HIV-1 DNA forms identified by the STS DNA-specific assay is indicated by the bracket on the right (dashed line indicates uncertainty).
FIG. 2.
FIG. 2.
Standard curves for HIV-1 STS DNA and 2LTRC templates and for human CCR5 templates utilized in the real-time PCR assays for quantifying HIV-1 STS and 2LTRC DNAs in human PBMC. Six serial dilutions ranging from 106 to 101 DNA templates were made for each DNA standard, and all standard dilutions were measured by real-time PCR using nucleotide sequence-specific molecular beacons. Average CT values (± standard deviations) were measured for eight replicates for each dilution point of the standard curve. The correlation coefficients (R2) of the three standard curves were >0.995, and the PCR efficiencies were >90%.
FIG. 3.
FIG. 3.
Distribution of baseline HIV-1 STS DNA levels (A), plasma RNA levels (B), and CD4+ T-cell counts (C) among 127 AIDS-free participants from the MHCS. Solid circles indicate subjects with detectable 2LTRC levels (>10 copies/106 PBMC). The lower limits of detection were 10 copies/106 PBMC (1.0 log10 copies/106 PBMC) for HIV-1 STS and 2LTRC DNAs in PBMC and 50 copies/ml (1.7 log10 copies/ml) for plasma HIV-1 RNA load.
FIG. 4.
FIG. 4.
Kaplan-Meier survival curves for participants from the MHCS were examined to assess the effect of baseline HIV-1 STS DNA levels in PBMC on progression to death (left) and clinical AIDS (right). Quartiles 1 through 4 correspond to fewer than 123, 124 to 443, 444 to 1,431, and more than 1,431 STS HIV-1 DNA copies/106 PBMC, respectively. The numbers of patients corresponding to each quartile at HIV-1 antibody seroconversion and every 4 years thereafter are given.
FIG. 5.
FIG. 5.
Kaplan-Meier survival curves for time to death (left) and time to clinical AIDS (right) from combined effects of baseline HIV-1 STS DNA and plasma RNA levels.
FIG. 6.
FIG. 6.
(A) Distribution of HIV-1 STS DNA levels obtained from longitudinal PBMC samples isolated from all participants. STS DNA levels were measured in all available stored samples isolated after HIV-1 antibody seroconversion and before initiation of effective antiretroviral therapy. The solid line represents the linear regression of the log10-transformed STS DNA levels and time of HIV-1 infection, and the dashed lines represent the corresponding 95% CI. (B) Distribution of STS DNA levels in longitudinal samples from seven participants who were long-term nonprogressors (open circles) and from seven randomly selected progressors (solid circles). HIV-1 STS DNA levels are shown against time of HIV-1 infection and relative to the best-fit curve and its 95% CI, derived from all study participants.

Similar articles

Cited by

References

    1. Aoki, S., R. Yarchoan, R. V. Thomas, J. M. Pluda, K. Marczyk, S. Broder, and H. Mitsuya. 1990. Quantitative analysis of HIV-1 proviral DNA in peripheral blood mononuclear cells from patients with AIDS or ARC: decrease of proviral DNA content following treatment with 2′,3′-dideoxyinosine (ddI). AIDS Res. Hum. Retrovir. 6:1331-1339. - PubMed
    1. Bieniasz, P. D., K. Ariyoshi, M. A. Bourelly, S. Bloor, R. B. Foxall, E. C. Harwood, and J. N. Weber. 1993. Variable relationship between proviral DNA load and infectious virus titre in the peripheral blood mononuclear cells of HIV-1-infected individuals. AIDS 7:803-806. - PubMed
    1. Bruisten, S. M., P. Reiss, A. E. Loeliger, P. van Swieten, R. Schuurman, C. A. Boucher, G. J. Weverling, and J. G. Huisman. 1998. Cellular proviral HIV type 1 DNA load persists after long-term RT-inhibitor therapy in HIV type 1 infected persons. AIDS Res. Hum. Retrovir. 14:1053-1058. - PubMed
    1. Butler, S. L., M. S. Hansen, and F. D. Bushman. 2001. A quantitative assay for HIV DNA integration in vivo. Nat. Med. 7:631-634. - PubMed
    1. Christopherson, C., Y. Kidane, B. Conway, J. Krowka, H. Sheppard, and S. Kwok. 2000. PCR-based assay to quantify human immunodeficiency virus type 1 DNA in peripheral blood mononuclear cells. J. Clin. Microbiol. 38:630-634. - PMC - PubMed

Publication types