. 2002 Oct;76(20):10290-8.
doi: 10.1128/jvi.76.20.10290-10298.2002.

Signal Transduction and Transcription Factor Modification during Reactivation of Epstein-Barr Virus from Latency

Affiliations

Signal Transduction and Transcription Factor Modification during Reactivation of Epstein-Barr Virus from Latency

Helen Bryant et al. J Virol. 2002 Oct.

Abstract

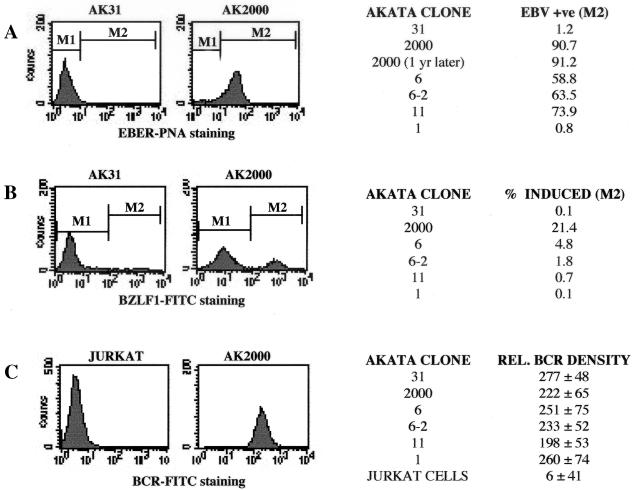
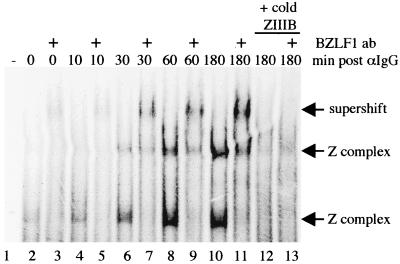
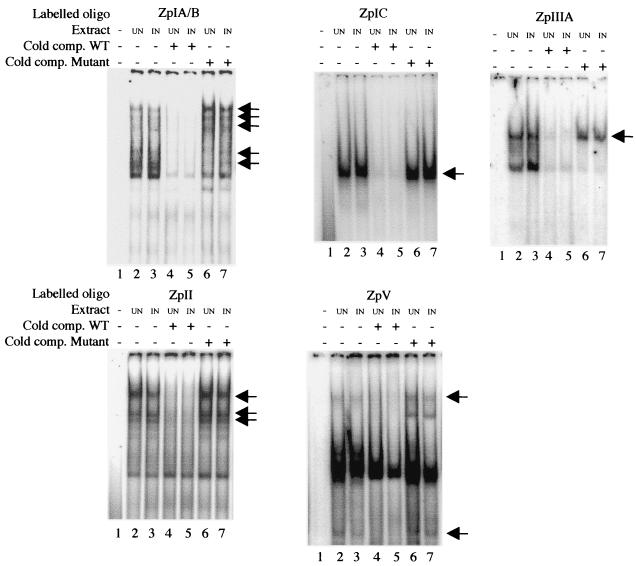
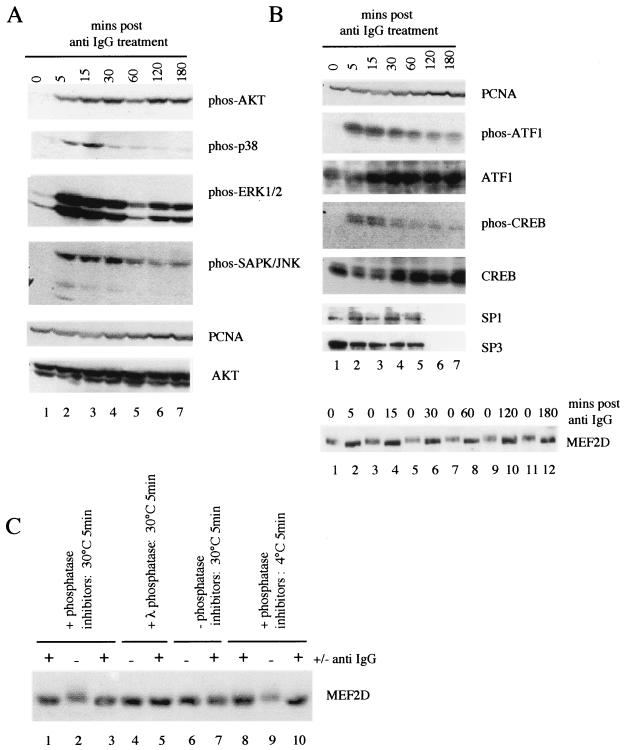
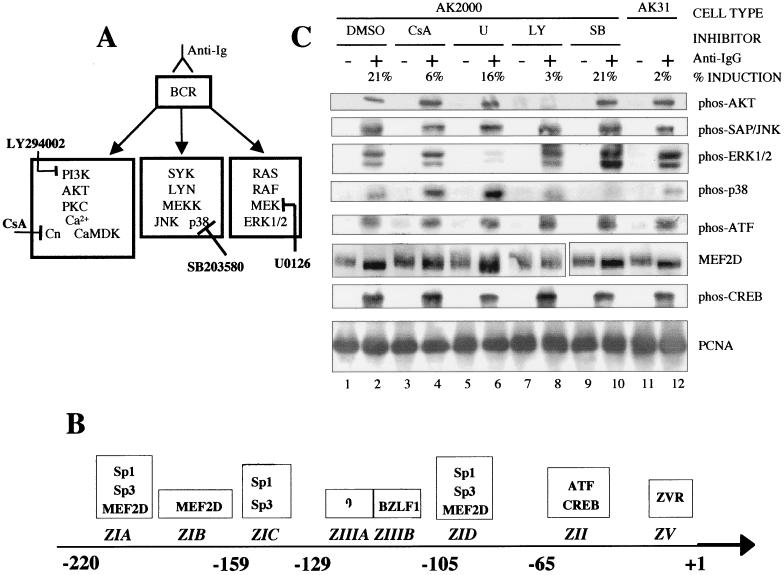
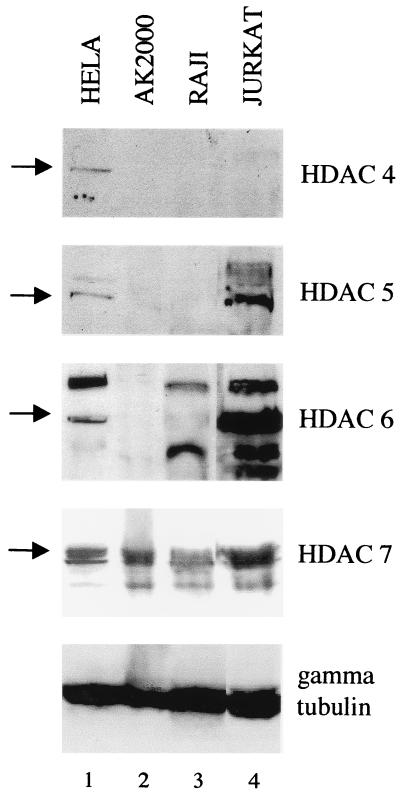
Reactivation of Epstein-Barr virus (EBV) from latency involves activation of the Zp promoter of the EBV BZLF1 gene. This occurs rapidly and efficiently in response to cross-linking the B-cell receptor on Akata Burkitt's lymphoma cells. After optimizing conditions for induction, signal transduction responses to B-cell receptor cross-linking were observed within 10 min, well before any autoactivation effects of BZLF1 protein. The primary events in reactivation were shown to involve dephosphorylation of the myocyte enhancer factor 2D (MEF-2D) transcription factor via the cyclosporin A-sensitive, calcium-mediated signaling pathway. This and other signal transduction events were correlated with the quantitative promoter analysis reported in the accompanying paper (U. K. Binné, W. Amon, and P. J. Farrell, this issue). Dephosphorylation of MEF-2D is known to be associated with histone acetylase recruitment, correlating with the histone acetylation at Zp during reactivation that we reported previously (Jenkins et al., J. Virol. 74:710-720, 2000). Histone deacetylation in response to phosphorylated MEF-2D can be mediated by class I or class II histone deacetylases (HDACs); HDAC 7 was the most readily detected class II HDAC in Akata and Raji cells, suggesting that it may be involved in Zp repression during latency.


Figures

FIG. 1.
FIG. 1.
Six Akata clones were stained with fluorescein isothiocyanate (FITC)-labeled peptide nucleic acid (PNA) probe directed against EBER RNA (A), with anti-BZLF1 monoclonal antibody and then a secondary anti-mouse Ig-fluorescein isothiocyanate conjugate (B), and with a fluorescein isothiocyanate-conjugated anti-BCR antibody (C). The percentage of positive cells was determined with linear gates M1 set at 1% on unstained AK2000 cells and M2 corresponding to a fluorescence signal greater than this. The relative BCR density was the mean FL1 (fluorescence signal from fluorescein isothiocyanate) value. In each case, an example of staining is shown, followed by a table of values for other clones. The two AK2000 values in panel A represent results of EBER flow cytometry analysis taken before and after cells were passaged continuously for 1 year.
FIG. 2.
FIG. 2.
Electrophoretic mobility shift assay with an oligonucleotide spanning the ZIIIB region of Zp and nuclear extracts prepared over a time course after anti-IgG treatment. Complexes were shown to contain BZLF1 by supershifting with BZ1 anti-BZLF1 monoclonal antibodies (lanes 3, 5, 7, 9, 11, and 13). Complexes were tested for specificity by competition with a 100-fold excess of unlabeled ZIIIB oligonucleotide (lanes 12 and 13). Specific complexes are marked by arrows. The uncomplexed probe was electrophoresed off the gel.
FIG. 3.
FIG. 3.
Electrophoretic mobility shift assay with oligonucleotides spanning regions of Zp (as indicated above each gel). Extracts used were from AK2000 cells untreated (UN) or treated with anti-IgG for 10 min (IN). Specificity of complexes was demonstrated by competition with a 100-fold excess of unlabeled wild-type (WT, lanes 4 and 5) or mutant oligonucleotide (lanes 6 and 7).
FIG. 4.
FIG. 4.
(A and B) Cells were treated with anti-IgG and extracts were prepared in a time course. Aliquots were assayed by Western blotting for the proteins indicated. Where phos precedes the protein name, the antibody was made against a phosphorylated form of the protein. (C) Cells were treated with anti-IgG or left untreated for 10 min, and then extracts were prepared. Aliquots were then incubated with or without phosphatase inhibitors or with 5 U of λ phosphatase for 5 min at the temperature indicated and assayed by Western blotting for MEF-2D.
FIG. 5.
FIG. 5.
(A) Diagram of pathways activated upon BCR cross-linking and sites of action of inhibitors used. Cn, calcineurin, CaMDK, calmodulin-dependent kinase; PI3K, phosphatidylinositol 3-kinase; PKC, protein kinase C. (B) Diagram of Zp elements (not to scale) and proteins shown previously to bind to them. The numbers refer to the nucleic acid position relative to the transcription start site. (C) AK2000 cells were treated with various cell signaling inhibitors or, as a control, with dimethyl sulfoxide (DMSO). They were then left (−) or induced with anti-IgG (+) for 10 min. A portion of the cells was removed, and protein extracts were made; the remainder of the cells were left at 37°C overnight. Aliquots of the protein extracts were assayed by Western blotting for the proteins indicated. Where phos precedes the protein name, the antibody was made against a phosphorylated form of the protein. AK31 cells were also induced and assayed along with the inhibitor-treated extracts. Percent induction corresponds to BZLF1-positive cells as determined by BZLF1-fluorescein isothiocyanate staining and flow cytometry analysis of the portion of cells left to induce overnight (Fig. 1B). CsA, cyclosporin A; U, U0126; LY, LY294002; SB, SB203580.
FIG. 6.
FIG. 6.
Total protein (50 μg) from four different cell lines was assayed by Western blotting for the indicated HDACs. The arrows mark the specific bands.

Similar articles

Cited by

References

    1. Adler, B., E. Schaadt, B. Kempkes, U. Zimber-Strobl, B. Baier, and G. W. Bornkamm. 2002. Control of Epstein-Barr virus reactivation by activated CD40 and viral latent membrane protein 1. Proc. Natl. Acad. Sci. USA 99:437-442. - PMC - PubMed
    1. Babcock, G. J., D. Hochberg, and A. D. Thorley-Lawson. 2000. The expression pattern of Epstein-Barr virus latent genes in vivo is dependent upon the differentiation stage of the infected B cell. Immunity 13:497-506. - PubMed
    1. Bauer, G., P. Hofler, and M. Simon. 1982. Epstein-Barr virus induction by a serum factor. Characterization of the purified factor and the mechanism of its activation. J. Biol. Chem. 257:11411-11415. - PubMed
    1. Biggin, M., P. J. Farrell, and B. G. Barrell. 1984. Transcription and DNA sequence of the BamHI L fragment of B95-8 Epstein-Barr virus. EMBO J. 3:1083-1090. - PMC - PubMed
    1. Binné, U. K., W. Amon, and P. J. Farrell. 2002. Promoter sequences required for reactivation of Epstein-Barr virus from latency. J. Virol. 76:10282-10289. - PMC - PubMed

MeSH terms

LinkOut - more resources