. 2002 Oct 1;99(20):13172-7.
doi: 10.1073/pnas.162485599. Epub 2002 Sep 19.

Parallel processing of serial movements in prefrontal cortex

Affiliations

Parallel processing of serial movements in prefrontal cortex

Bruno B Averbeck et al. Proc Natl Acad Sci U S A. .

Abstract

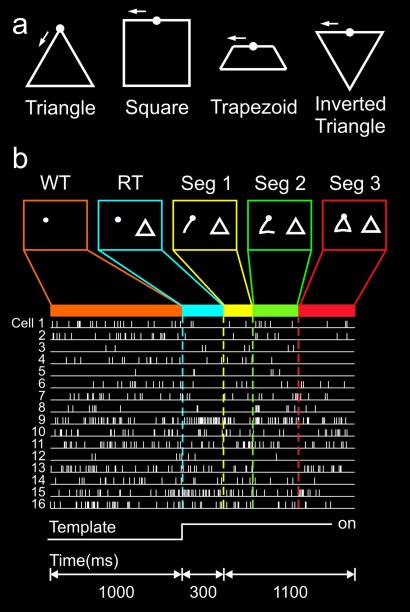
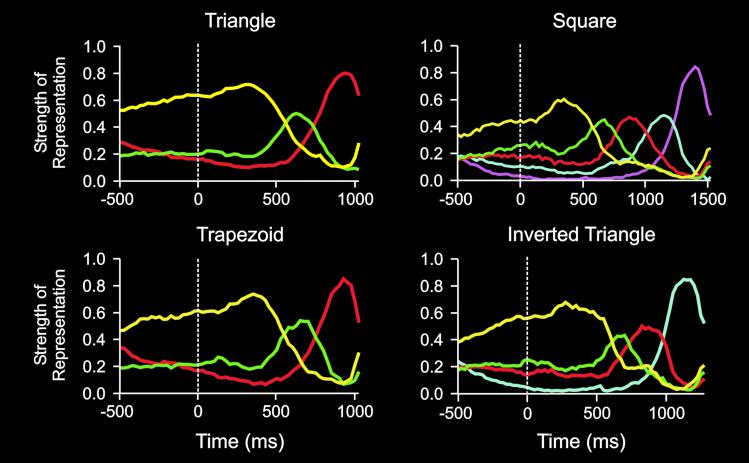
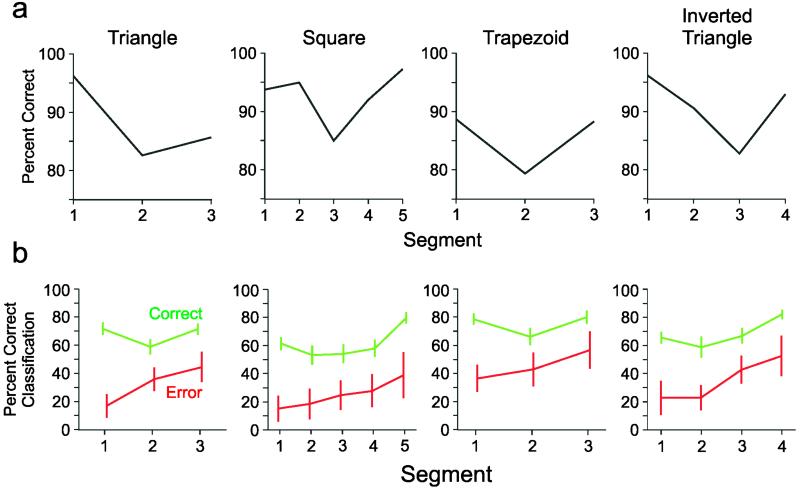
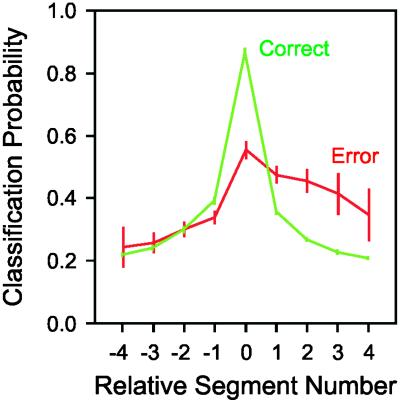
A key idea in Lashley's formulation of the problem of serial order in behavior is the postulated neural representation of all serial elements before the action begins. We studied this question by recording the activity of individual neurons simultaneously in small ensembles in prefrontal cortex while monkeys copied geometrical shapes shown on a screen. Monkeys drew the shapes as sequences of movement segments, and these segments were associated with distinct patterns of neuronal ensemble activity. Here we show that these patterns were present during the time preceding the actual drawing. The rank of the strength of representation of a segment in the neuronal population during this time, as assessed by discriminant analysis, predicted the serial position of the segment in the motor sequence. An analysis of errors in copying and their neural correlates supplied additional evidence for this code and provided a neural basis for Lashley's hypothesis that errors in motor sequences would be most likely to occur when executing elements that had prior representations of nearly equal strength.


Figures

Figure 1
Figure 1
Shapes drawn, behavioral task and ensemble raster for one trial. (a) The four shapes drawn by the monkeys. The circle at the center of the top indicates the starting point for each shape. The arrow indicates the direction in which the shapes were copied. (b) The screens indicate the display during each of the phases of a single trial. The monkey had to maintain the cursor in the start hold circle for the WT. At the end of the WT, a template appeared and the monkey drew the shape. Shapes were drawn in blocks of trials such that several trials of the same shape had to be completed before a new shape was presented. This gave the monkey knowledge of the shape during the WT, before the template appeared. The raster at the bottom shows a single trial for 16 simultaneously recorded cells.
Figure 2
Figure 2
Plots for all four shapes of strength of representation vs. time. Each plot shows the strength of the representation of each segment for each time bin of the task. Time 0 indicates the onset of the template. Time bins during hold period and RT are 25 ms. Length of segments were normalized to permit averaging across trials. Plots show parallel representation of segments before initiation of copying. Further, rank order of strength of representation before coping corresponds to the serial position of the segment in the series. The rank order evolves during the drawing to maintain the serial position code. Line color corresponds to segments as follows: yellow, segment 1; green, segment 2; red, segment 3; cyan, segment 4; magenta, segment 5. Not all lines are defined for all shapes.
Figure 3
Figure 3
Serial position curves and classification performance on correct and error trials. (a) Graphs show the percent correct performance for each segment for each shape. The primacy/recency effect can be see in the higher percent correct performance for the early and late segments of a shape, and the relative decrease in performance for the middle segments of the shape. (b) Classification performance (mean ± 2 SEM) on correct (green lines) and error (red lines) trials. The neural activity pattern of each segment was classified by using the discriminant analysis. The neural activity patterns during the correct trials classified as the current segment much more often than the neural activity patterns during the error trials.
Figure 4
Figure 4
Classification probability for relative segment number. By using the same analysis as in Fig. 2, the segment to which the neural activity during the drawing of a segment was classified is plotted as a probability. On correct trials (green line), the neural activity usually was classified as the segment being drawn (segment 0). Furthermore, misclassifications are symmetric. On error trials, the neural activity classifies to the current segment much less often. Interestingly, the misclassifications are predominately to subsequent segments of the shape. Thus, on error trials, the ensembles tend to represent subsequent segments of the shape. Data points are mean ± 2 SEM.

References

    1. Lashley K. In: Cerebral Mechanisms in Behavior. Jeffress L A, editor. New York: Wiley; 1951. pp. 112–136.
    1. Shallice T. Psychol Rev. 1972;79:383–393. - PubMed
    1. MacNeilage P F. Lang Speech. 1964;7:144–159.
    1. MacKay D G. Neuropsychologia. 1970;8:323–350. - PubMed
    1. Rumelhart D E, Norman D A. Cogit Sci. 1982;5:1–36.

Publication types

LinkOut - more resources