Comparative Study
. 2002 Oct;184(20):5733-45.
doi: 10.1128/JB.184.20.5733-5745.2002.

Correlations between Shine-Dalgarno sequences and gene features such as predicted expression levels and operon structures

Affiliations
Comparative Study

Correlations between Shine-Dalgarno sequences and gene features such as predicted expression levels and operon structures

Jiong Ma et al. J Bacteriol. 2002 Oct.

Abstract

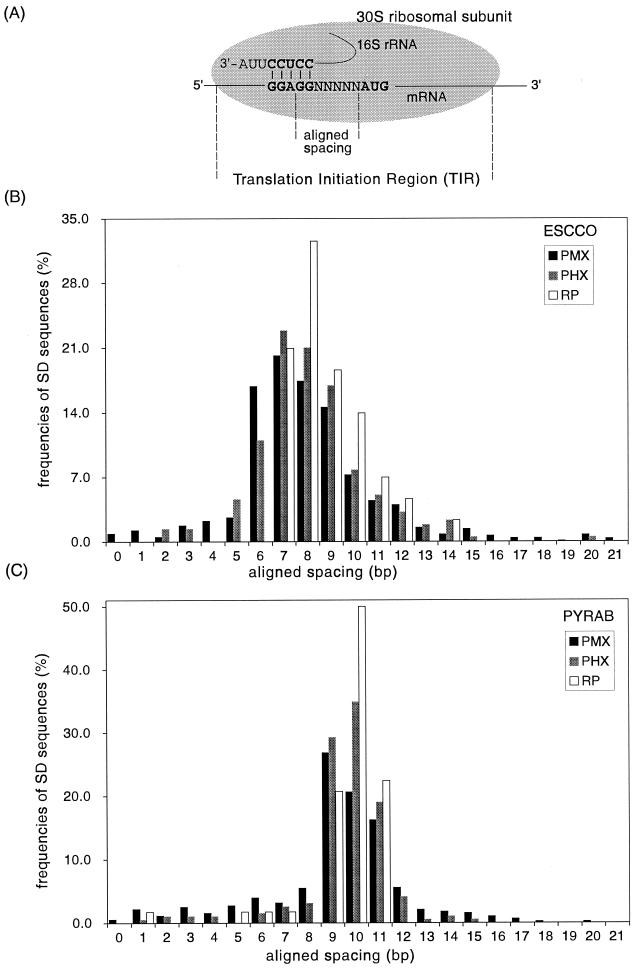
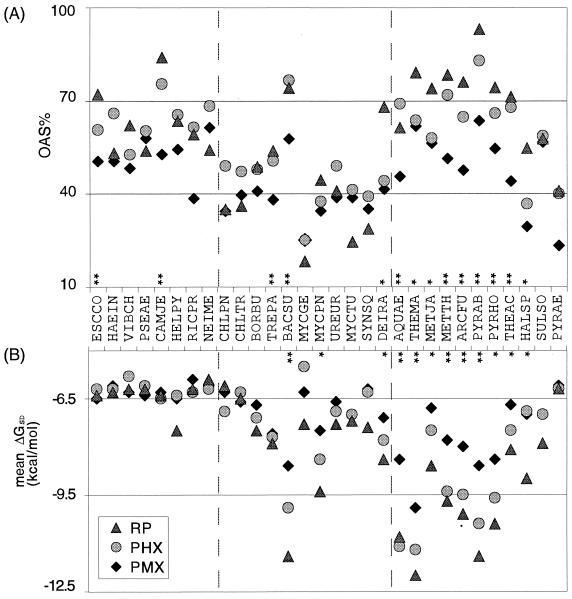
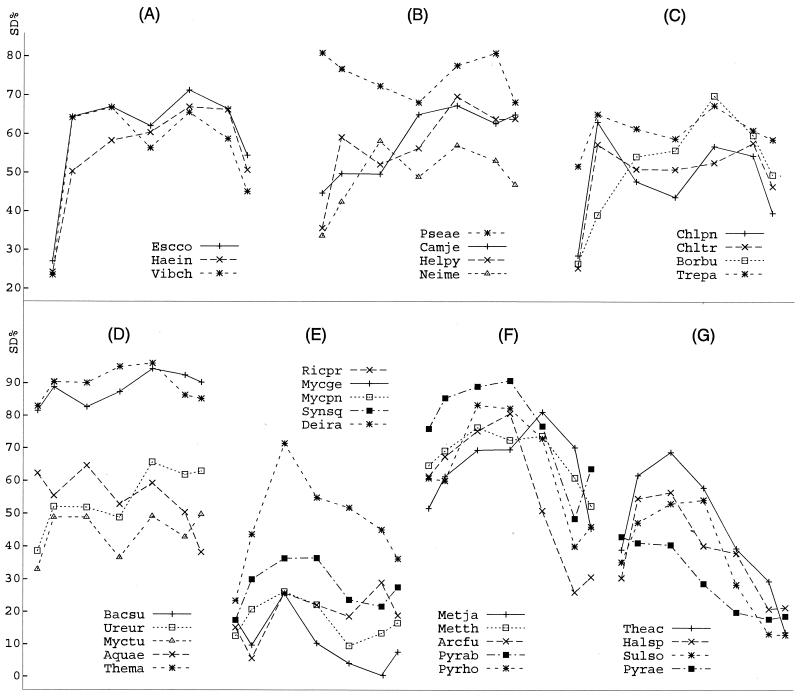
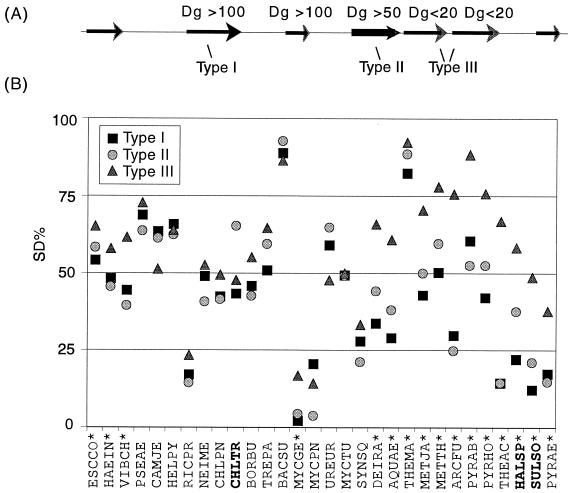
This work assesses relationships for 30 complete prokaryotic genomes between the presence of the Shine-Dalgarno (SD) sequence and other gene features, including expression levels, type of start codon, and distance between successive genes. A significant positive correlation of the presence of an SD sequence and the predicted expression level of a gene based on codon usage biases was ascertained, such that predicted highly expressed genes are more likely to possess a strong SD sequence than average genes. Genes with AUG start codons are more likely than genes with other start codons, GUG or UUG, to possess an SD sequence. Genes in close proximity to upstream genes on the same coding strand in most genomes are significantly higher in SD presence. In light of these results, we discuss the role of the SD sequence in translation initiation and its relationship with predicted gene expression levels and with operon structure in both bacterial and archaeal genomes.


Figures

FIG. 1.
FIG. 1.
Distribution of aligned spacings of SD sequences for RP, PHX, and PMX gene classes. (A) Simplified diagram of the translation initiation complex formed between an E. coli mRNA and the 30S ribosomal subunit. The aligned spacing is designated as the distance between the center of the SD sequence GGAGG and the start codon AUG. (B and C) Histograms of the SD aligned spacings in the genomes of Escherichia coli K-12 (ESCCO) and Pyrococcus abyssi (PYRAB), respectively.
FIG. 2.
FIG. 2.
SD sequences for RP, PHX, and PMX gene classes. (A) The y axis, OAS%, is the fraction of SD sequences present at the three OAS (given in Table 1) for each gene class. * indicates genomes where the OAS% for RP is significantly higher than for PMX genes (P < 0.05 for a χ2 test using the Yates correction). ** indicates that the OAS% for both the RP and PHX genes are significantly higher than for the PMX genes. (B) The y axis shows mean ΔGSD, the mean free energy of binding of the SD sequences in a gene group. * indicates genomes where the mean ΔGSD for the RP genes is significantly less than that for the PMX genes (the difference is at least 20% of the bacterial mean ΔGSD, or 1.3 kcal/mol); ** indicates that the mean ΔGSD for both the RP and PHX genes is significantly less than for the PMX genes. Abbreviations: ESCCO, Escherichia coli; HAEIN, Haemophilus influenzae; VIBCH, Vibrio cholerae; PSEAE, Pseudomonas aeruginosa; CAMJE, Campylobacter jejuni; HELPY, Helicobacter pylori; RICPR, Rickettsia prowazekii; NEIME, Neisseria meningitidis; CHLPN, Chlamydophila pneumoniae; CHLTR, Chlamydia trachomatis; BORBU, Borrelia burgdorferi; TREPA, Treponema pallidum; BACSU, Bacillus subtilis; MYCGE, Mycobacterium genitalium; MYCPN, Mycobacterium pneumoniae; UREUR, Ureaplasma urealyticum; MYCTU, Mycobacterium tuberculosis; SYNSQ, Synechocystis sp. strain PCC6803; DEIRA, Deinococcus radiodurans; AQUAE, Aquifex aeolicus; THEMA, Thermotoga maritima; METJA, Methanococcus jannaschii; METTH, Methanobacterium thermoautotrophicum; ARCFU, Archaeoglobus fulgidus; PYRAB, Pyrococcus abyssi; PYRHO, Pyrococcus horikoshii; THEAC, Thermoplasma acidophilum; HALSP, Halobacterium sp. strain NRC-1; SULSO, Sulfolobus solfataricus; PYRAE, Pyrococcus aerophilum.
FIG. 3.
FIG. 3.
Relationship between SD% and distances between successive genes (Dg). The y axis represents SD%. The symbols for the lines and points for each plot are shown. In each plot, the seven data points represent seven Dg groups (from left to right): genes with a Dg of less than −20 bp; five groups of genes with a Dg from −20 to 30 bp, at 10-bp intervals; and genes with a Dg of more than 30 bp (see Supplementary Data Table S-5 for details of the groups). For abbreviations, see the legend to Fig. 2.
FIG. 4.
FIG. 4.
SD sequences for genes with different internal positions. (A) How the three types of genes were classified (see text for details). (B) Asterisks indicate genomes where the SD% for type III genes is significantly higher than that for type I genes. Boldface indicates that the SD% for the type II genes was significantly higher than for the type I genes (P < 0.05 for a χ2 test using the Yates correction). For abbreviations, see the legend to Fig. 2.

References

    1. Antelmann, H., J. Bernhardt, R. Schmid, H. Mach, U. Volker, and M. Hecker. 1997. First steps from a two-dimensional protein index towards a response-regulation map for Bacillus subtilis. Electrophoresis 18:1451-1463. - PubMed
    1. Ban, N., P. Nissen, J. Hansen, P. B. Moore, and T. A. Steitz. 2000. The complete atomic structure of the large ribosomal subunit at 2.4 A resolution. Science 289:905-920. - PubMed
    1. Besemer, J., A. Lomsadze, and M. Borodovsky. 2001. GeneMarkS: a self-training method for prediction of gene starts in microbial genomes. Implications for finding sequence motifs in regulatory regions. Nucleic Acids Res. 29:2607-2618. - PMC - PubMed
    1. Blattner, F. R., G. Plunkett III, C. A. Bloch, N. T. Perna, V. Burland, M. Riley, J. Collado-Vides, J. D. Glasner, C. K. Rode, G. F. Mayhew, J. Gregor, N. W. Davis, H. A. Kirkpatrick, M. A. Goeden, D. J. Rose, B. Mau, and Y. Shao. 1997. The complete genome sequence of Escherichia coli K-12. Science 277:1453-1474. - PubMed
    1. Brodersen, D. E., W. M. Clemons, Jr., A. P. Carter, R. J. Morgan-Warren, B. T. Wimberly, and V. Ramakrishnan. 2000. The structural basis for the action of the antibiotics tetracycline, pactamycin, and hygromycin B on the 30S ribosomal subunit. Cell 103:1143-1154. - PubMed

Publication types

MeSH terms

Associated data

LinkOut - more resources