. 2002 Oct 1;99(20):13330-5.
doi: 10.1073/pnas.202244299. Epub 2002 Sep 23.

Modeling dynamic and network heterogeneities in the spread of sexually transmitted diseases

Affiliations

Modeling dynamic and network heterogeneities in the spread of sexually transmitted diseases

Ken T D Eames et al. Proc Natl Acad Sci U S A. .

Abstract

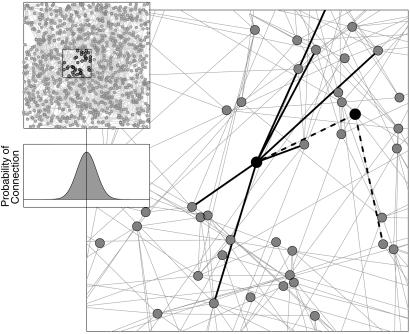
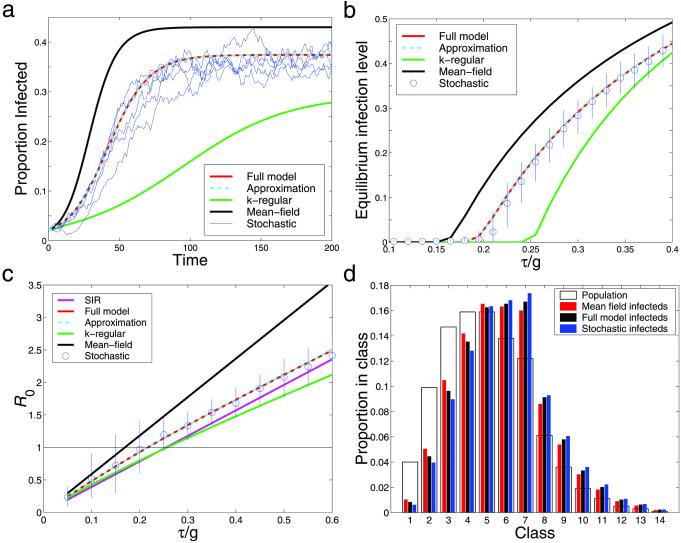
A wide range of communicable human diseases can be considered as spreading through a network of possible transmission routes. The implied network structure is vital in determining disease dynamics, especially when the average number of connections per individual is small as is the case for many sexually transmitted diseases (STDs). Here we develop an intuitive mathematical framework to deal with the heterogeneities implicit within contact networks and those that arise because of the infection process. These models are compared with full stochastic simulations and show excellent agreement across a wide range of parameters. We show how such models can be used to estimate parameters of epidemiological importance, and how they can be extended to examine the effectiveness of various control strategies, in particular screening programs and contact tracing.


Figures

Figure 1
Figure 1
An example of the full computer-generated contact network (Upper Inset) and a magnified section (main graph). Individuals are placed at random within the environment at an average density of one per unit area. The probability kernel determining the connection of two nodes (shown at the same scale as the full network in the Lower Inset) is the sum of a localized Gaussian (whose height and breadth may be specified) and a fixed probability representing global connections. Hence, the probability of connection between nodes a distance d apart is P(d) = U + μed2/2σ2, where U, μ, and σ may be varied. The majority of the neighbors of a node are close by, with a smaller number of long-distance edges. To indicate the heterogeneities present in the network structure, two connected nodes are highlighted on the main figure. One node has only two relatively local neighbors, whereas the other possesses seven local and one longer range (out of shot) connection. Throughout the paper U = 0.0025, μ = 0.21, and σ = 2.5.
Figure 2
Figure 2
The graphs show stochastic iterations (blue) and four deterministic models carried out on the same computer-generated network: the full pair-wise model (Eq. 6) (red) and the approximation (Eq. 8) (cyan), as well as a mean-field model (Eq. 2) (black) and a k-regular pair-wise model (green) where all individuals are assumed to have the same, mean, number of neighbors k. (a) Typical time series with infection parameter τ/g = 0.35. (b) Equilibrium levels of infection over a range of the parameter τ/g including the mean and 90% confidence intervals from 200 stochastic iterations. (c) The basic reproductive ratio, R0, over a range of the parameter τ/g; also included is the analytic value for an SIR type infection (mauve); the difference between the SIS and SIR approaches is evident. The stochastic R0 is estimated by using the distribution of infection when the epidemic has reached the (low) level of infection at which, in the full model, growth rate hits its early-stage equilibrium. (d) The equilibrium distribution of infected individuals throughout the population compared with the distribution of all individuals, for τ/g = 0.27; more highly connected nodes, representing increasingly promiscuous individuals, are at a greater risk of infection.
Figure 3
Figure 3
(a) Estimation of τ/g by using the prevalence of infection on a network taken from Wylie and Jolly (11), for chlamydia and gonorrhea and three different models: the full pair-wise, the mean-field, and the k-regular. (b) For the same network, evaluation of the effectiveness of control strategies by using the pair-wise network model. The equilibrium infection prevalence is shown as the two control methods are varied. One is the infection parameter τ/g relative to the estimated value; this is a measure of the change in infectivity attributable to random screening or public awareness. The other is the contact tracing efficiency, the proportion of infected partners who are successfully traced and treated once an index case is identified. The dashed red line shows the corresponding extinction threshold for the mean-field model, which is unaffected by contact tracing.

References

    1. Joint United Nations Program on HIV/AIDS and World Health Organization. AIDS Epidemic Update: December 2001. Geneva: UNAIDS; 2001.
    1. Centers for Disease Control and Prevention. Sexually Transmitted Disease Surveillance, 2000. Centers for Disease Control and Prevention, Atlanta: U.S. Department of Health and Human Services; 2001.
    1. PHLS; DHSS & PS; the Scottish ISD(D)5 Collaborative Group. Trends in Sexually Transmitted Infections in the United Kingdom, 1990–1999. London: Public Health Laboratory Service; 2000.
    1. Piot P, Bartos M, Ghys P D, Walker N, Schwartländer B. Nature (London) 2001;410:968–973. - PubMed
    1. Mollison D. J R Stat Soc B. 1977;39:283–326.

Publication types