

FlgM gains structure in living cells
- PMID: 12271132
- PMCID: PMC130520
- DOI: 10.1073/pnas.202331299
FlgM gains structure in living cells
Abstract
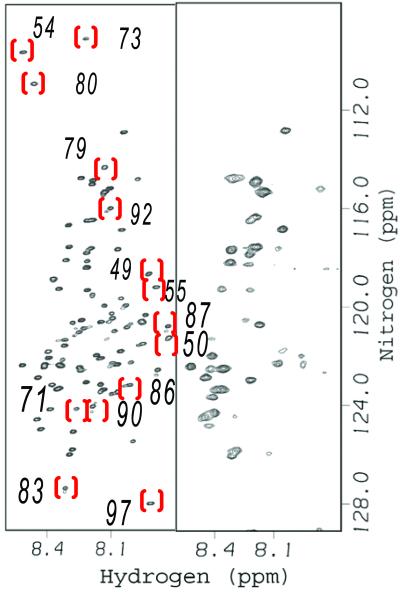
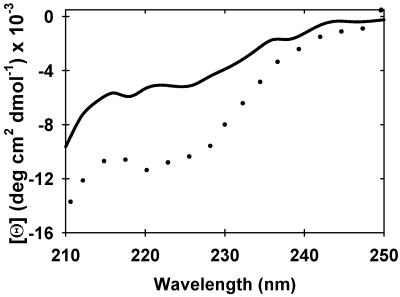
Intrinsically disordered proteins such as FlgM play important roles in biology, but little is known about their structure in cells. We use NMR to show that FlgM gains structure inside living Escherichia coli cells and under physiologically relevant conditions in vitro, i.e., in solutions containing high concentrations (>/=400 g/liter) of glucose, BSA, or ovalbumin. Structure formation represents solute-induced changes in the equilibrium between the structured and disordered forms of FlgM. The results provide insight into how the environment of intrinsically disordered proteins could dictate their structure and, in turn, emphasize the relevance of studying proteins in living cells and in vitro under physiologically realistic conditions.
Figures


References
-
- Dunker A K, Brown C J, Lawson J D, Iakoucheva L M, Obradovic Z. Biochemistry. 2002;41:6573–6582. - PubMed
-
- Uversky V N, Gillespie J R, Fink A L. Proteins Struct Funct Genet. 2000;41:415–427. - PubMed
-
- Hughes K T, Gillen K L, Semon M J, Karlinsey J E. Science. 1993;262:1277–1280. - PubMed
-
- Daughdrill G W, Hanely L J, Dahlquist F W. Biochemistry. 1998;37:1076–1082. - PubMed
-
- Schulman B A, Kim P S, Dobson C M, Redfield C. Nat Struct Biol. 1997;4:630–634. - PubMed
Publication types
MeSH terms
Substances
LinkOut - more resources
Full Text Sources
Other Literature Sources
Molecular Biology Databases
