

Pimecrolimus inhibits up-regulation of OX40 and synthesis of inflammatory cytokines upon secondary T cell activation by allogeneic dendritic cells
- PMID: 12296857
- PMCID: PMC1906497
- DOI: 10.1046/j.1365-2249.2002.01962.x
Pimecrolimus inhibits up-regulation of OX40 and synthesis of inflammatory cytokines upon secondary T cell activation by allogeneic dendritic cells
Erratum in
- Clin Exp Immunol 2002 Dec;130(3):562-3
Abstract
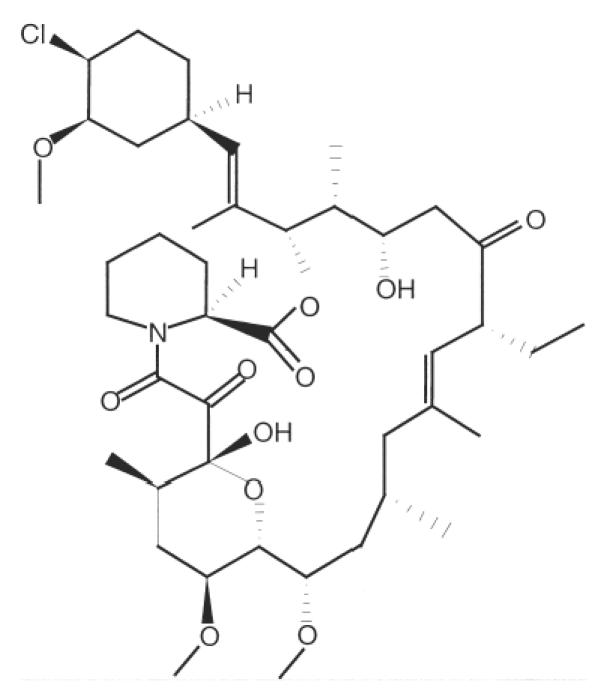
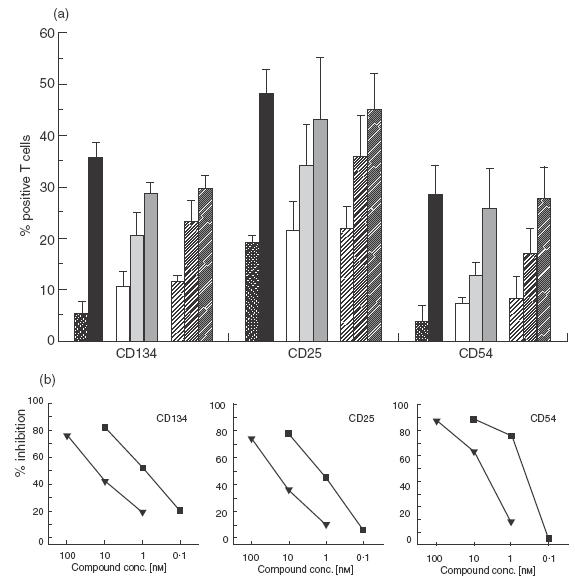
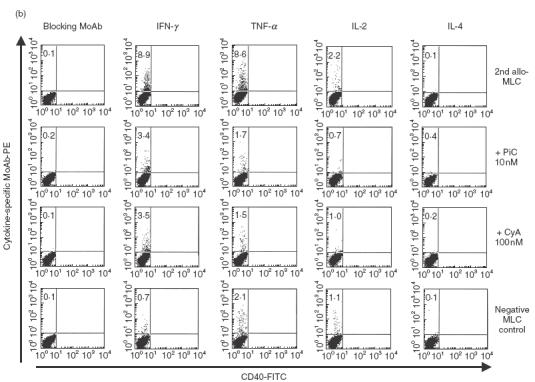
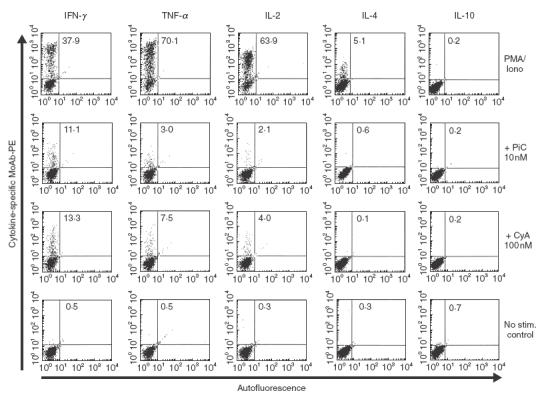
Pimecrolimus is a new non-steroidal inhibitor of T cell and mast cell activation. In the present study, we compared the potency of pimecrolimus and cyclosporin A (CyA) to inhibit cytokine synthesis of alloantigen-primed T cells and the expression of CD134 (OX40), an inducible co-receptor molecule thought to be critical for the survival and expansion of inflammation-mediating T cells. To mimic the physiological situation of recurrent antigenic stimulation, we have used dendritic cells (DC) as stimulators of purified CD4+ T cells in the primary and secondary allogeneic mixed lymphocyte culture (allo-MLC). Pimecrolimus inhibited surface expression of OX40 and prevented the up-regulation of CD25 and CD54 with a 10-fold higher potency compared to CyA. Similarly, 50% inhibition of allo-DC-mediated T cell proliferation by pimecrolimus was obtained at 0.55 nm, compared to about 12 nm for CyA. Furthermore, pimecrolimus blocked the increase of OX40 on primed T cells restimulated on day 10 in secondary allo-MLC. Allo-DC-primed T cells showed a restricted cytokine profile characterized by the production of TNF-alpha, IFN-gamma and IL-2 but low to undetectable levels of IL-4 and IL-10. The synthesis of TNF-alpha and IFN-gamma and the up-regulation of OX40 on T cells after secondary allogeneic stimulation were almost entirely blocked by 10 nm pimecrolimus. Taken together, pimecrolimus inhibits T cell proliferation and Th1 cytokine synthesis and also prevents the up-regulation of the OX40 co-receptor on primed T cells indicating its potential in the therapy of chronic inflammation and autoimmunity.
Figures
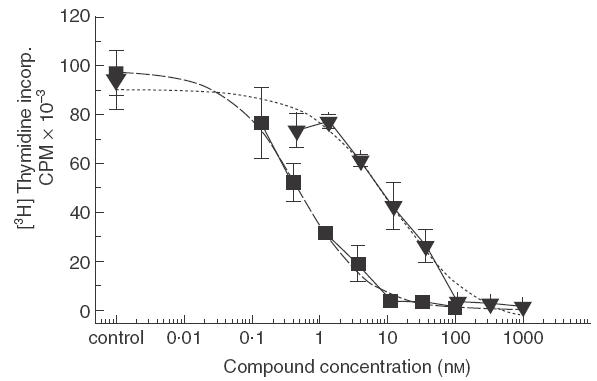
 ., CyA; IC50 = 11·8 n
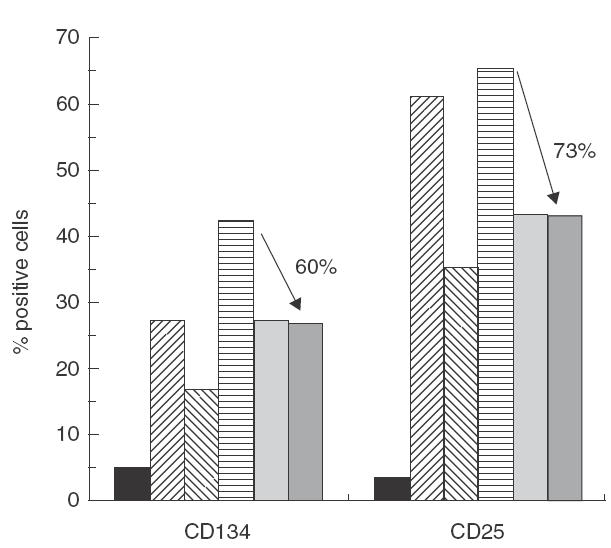
 , day 10: time of RS;
  , day 14: no RS control;
  , day 14: RS control;
 , day 14: RS + CyA (100 n
 , day 14: RS + PiC (10 n
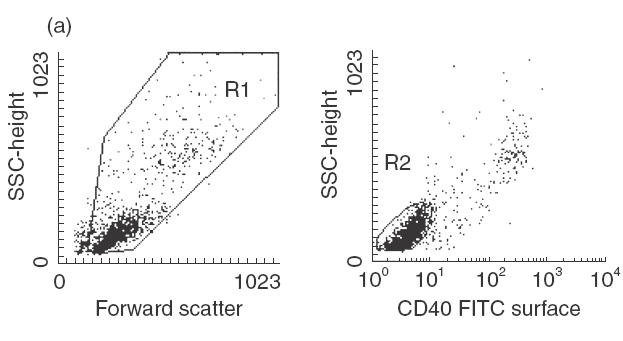
Similar articles
-
Differential inhibition of primary versus preactivated T cells by pimecrolimus but not by tacrolimus in vitro.Int Arch Allergy Immunol. 2007;142(3):255-64. doi: 10.1159/000097028. Epub 2006 Nov 15. Int Arch Allergy Immunol. 2007. PMID: 17114891
-
Strong expression of CD134 (OX40), a member of the TNF receptor family, in a T helper 2-type cytokine environment.J Leukoc Biol. 1998 Oct;64(4):503-10. doi: 10.1002/jlb.64.4.503. J Leukoc Biol. 1998. PMID: 9766631
-
Multiple levels of activation of murine CD8(+) intraepithelial lymphocytes defined by OX40 (CD134) expression: effects on cell-mediated cytotoxicity, IFN-gamma, and IL-10 regulation.J Immunol. 2001 Dec 15;167(12):6717-23. doi: 10.4049/jimmunol.167.12.6717. J Immunol. 2001. PMID: 11739485
-
OX40: targeted immunotherapy--implications for tempering autoimmunity and enhancing vaccines.Trends Immunol. 2002 Feb;23(2):102-9. doi: 10.1016/s1471-4906(01)02127-5. Trends Immunol. 2002. PMID: 11929124 Review.
-
Roles of IL-1 in the development of rheumatoid arthritis: consideration from mouse models.Cytokine Growth Factor Rev. 2002 Aug-Oct;13(4-5):341-55. doi: 10.1016/s1359-6101(02)00021-7. Cytokine Growth Factor Rev. 2002. PMID: 12220548 Review.
Cited by
-
[New immunosuppressive agents for treating psoriasis].Hautarzt. 2003 Mar;54(3):230-6. doi: 10.1007/s00105-003-0499-0. Epub 2003 Feb 18. Hautarzt. 2003. PMID: 12634991 German.
-
Ovalicin attenuates atopic dermatitis symptoms by inhibiting IL-31 signaling and intracellular calcium influx.J Biomed Res. 2021 Jun 16;35(6):448-458. doi: 10.7555/JBR.35.20210012. J Biomed Res. 2021. PMID: 34497158 Free PMC article.
-
[Development and pre-clinical aspects of pimecrolimus].Hautarzt. 2003 May;54(5):405-12. doi: 10.1007/s00105-003-0519-0. Epub 2003 Apr 5. Hautarzt. 2003. PMID: 12719859 German.
-
The chronicity of tonsillitis is significantly correlated with an increase in an LTi cell portion.Inflammation. 2014 Feb;37(1):132-41. doi: 10.1007/s10753-013-9721-0. Inflammation. 2014. PMID: 24022597
-
Topical pimecrolimus: a review of its use in the management of pediatric atopic dermatitis.Paediatr Drugs. 2009;11(6):407-26. doi: 10.2165/10481960-000000000-00000. Paediatr Drugs. 2009. PMID: 19877726 Review.
References
-
- Jenkins MK, Taylor PS, Norton SD, Urdahl KB. CD28 delivers a co-stimulatory signal involved in antigen-specific IL-2 production by human T cells. J Immunol. 1991;147:2461–6. - PubMed
-
- June CH, Bluestone JA, Nadler LM, Thompson CB. The B7 and CD28 receptor families. Immunol Today. 1994;15:321–31. - PubMed
-
- Linsley PS, Ledbetter JA. The role of the CD28 receptor during T cell responses to antigen. Ann Rev Immunol. 1993;11:191–212. - PubMed
-
- Smith CA, Farrah T, Goodwin RG. The TNF receptor superfamily of cellular and viral proteins: activation, co-stimulation, and death. Cell. 1994;76:959–62. - PubMed
-
- Latza U, Dürkop H, Schnittger S, et al. The human OX40 homolog. cDNA structure, expression and chromosomal assignment of the ACT35 antigen. Eur J Immunol. 1994;24:677–83. - PubMed
Publication types
MeSH terms
Substances
LinkOut - more resources
Full Text Sources
Research Materials
