. 2002 Oct 1;99(20):12877-82.
doi: 10.1073/pnas.162488599. Epub 2002 Sep 24.

Diversity, topographic differentiation, and positional memory in human fibroblasts

Affiliations

Diversity, topographic differentiation, and positional memory in human fibroblasts

Howard Y Chang et al. Proc Natl Acad Sci U S A. .

Abstract

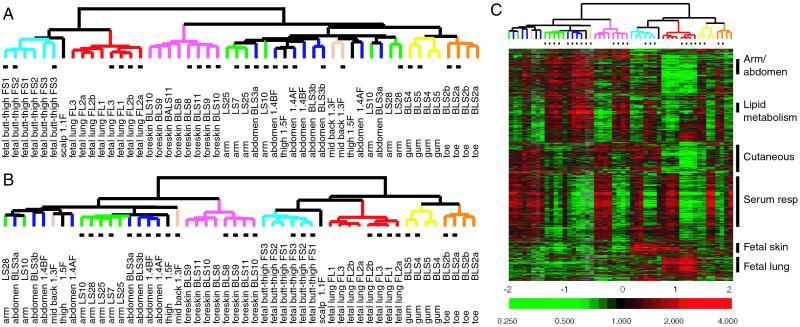
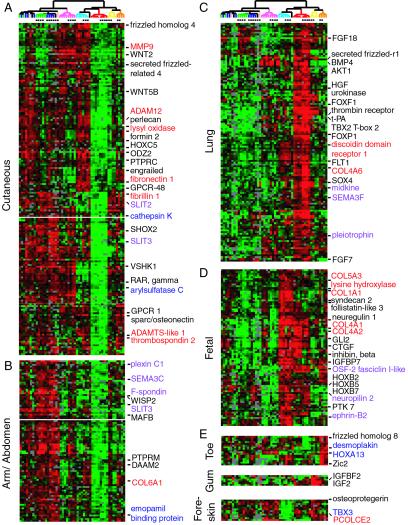
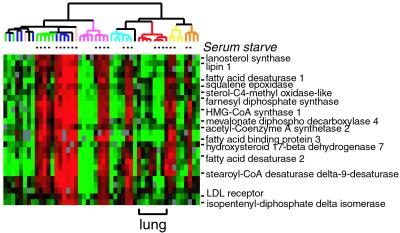
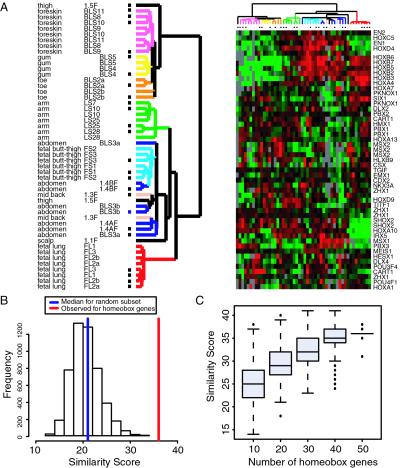
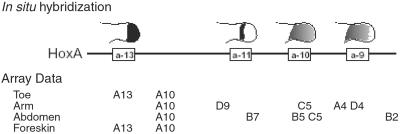
A fundamental feature of the architecture and functional design of vertebrate animals is a stroma, composed of extracellular matrix and mesenchymal cells, which provides a structural scaffold and conduit for blood and lymphatic vessels, nerves, and leukocytes. Reciprocal interactions between mesenchymal and epithelial cells are known to play a critical role in orchestrating the development and morphogenesis of tissues and organs, but the roles played by specific stromal cells in controlling the design and function of tissues remain poorly understood. The principal cells of stromal tissue are called fibroblasts, a catch-all designation that belies their diversity. We characterized genome-wide patterns of gene expression in cultured fetal and adult human fibroblasts derived from skin at different anatomical sites. Fibroblasts from each site displayed distinct and characteristic transcriptional patterns, suggesting that fibroblasts at different locations in the body should be considered distinct differentiated cell types. Notable groups of differentially expressed genes included some implicated in extracellular matrix synthesis, lipid metabolism, and cell signaling pathways that control proliferation, cell migration, and fate determination. Several genes implicated in genetic diseases were found to be expressed in fibroblasts in an anatomic pattern that paralleled the phenotypic defects. Finally, adult fibroblasts maintained key features of HOX gene expression patterns established during embryogenesis, suggesting that HOX genes may direct topographic differentiation and underlie the detailed positional memory in fibroblasts.


Figures

Figure 1
Figure 1
Topographic differentiation of fibroblasts. (A) Unsupervised hierarchical clustering of cultured fibroblasts. The global gene expression patterns of 50 fibroblast cultures were sorted based on similarity by hierarchical clustering. Approximately 1,400 genes were selected from the total data set based on variance more than 3-fold in at least two arrays. The site of origin of each fibroblast culture is indicated and color-coded. Fibroblasts cultured in minimal-serum medium (0.1% FCS) are indicated by black dots below the dendrogram. (B) Supervised hierarchical clustering of cultured fibroblasts was performed by using approximately 1,600 genes identified by SAM (9) that varied according to fibroblast site of origin. Serum-starved samples are indicated by black dots below the dendrogram. (C) Topography transcriptome of fibroblasts. The variation in expression of approximately 1,600 genes described in B are shown in matrix format (8). The scale extends from 0.25- to 4-fold over mean (−2 to +2 in log2 space) as is indicated on the bottom. Gray represents missing data. Gene clusters are indicated on the right.
Figure 2
Figure 2
Features of the topography transcriptome. Select genes from the cutaneous cluster (A), arm/abdomen (B), fetal lung (C), fetal lung and skin (D), and other sites (E) are shown. The names of genes involved in ECM synthesis (red), cell signaling or fate determination (black), cell migration guidance (purple), and genes mutated in inherited human diseases (blue) are labeled by the indicated colors. The order of samples and scale are the same as Fig. 1 B and C.
Figure 3
Figure 3
Coordinated variation in expression of genes involved in lipid and sterol metabolism. Note the correspondence between cultivation in low-serum (and thus low LDL) medium and activation of the lipid cluster genes in all the fibroblast cultures with the distinct exception of fetal lung fibroblasts. The order of samples and scale are the same as Fig. 1 B and C.
Figure 4
Figure 4
HOX genes and topographic differentiation. (A) Hierarchical clustering of fibroblast cultures based solely on expression of genes encoding homeodomain proteins reproduces the clustering by site of origin. Of 88 homeodomain-containing genes on the array, 51 were considered well measured as indicated by reference channel intensity over background ≥ 1.5-fold and no less than 80% informative data. Hierarchical clustering was performed with these 51 genes, and the result is displayed in the same format as in Fig. 1. Scale is the same as Fig. 1C. (B) Statistical significance of topographic clustering by homeobox genes. The 51 homeobox genes identified above were clustered by using Partitioning Around Medoids (PAM) with k = 6 clusters and 45 arrays (see Materials and Methods). The sites of origin of the fibroblast samples (abdominal skin, arm, fetal buttock thigh, fetal lung, foreskin, toe, and gum) were taken as the reference grouping of six clusters. The similarity score comparing the PAM clustering to the known site of origin is 36 of a maximum of 45. To assess the statistical significance of the similarity score, 5,000 sets of 51 random genes from a data set of 19,081 genes filtered as in A were subjected to the same analysis and the histogram of the similarity scores are shown. The median of the 5,000 similarity scores is shown in blue (21 of 45). None of the 5,000 trials achieved a score of 36; thus the P value is 0/5,000. (C) Robustness of topographic clustering. The same analysis in B was carried out for 500 of random subsets of 10, 20, 30, 40, or 50 homeobox genes. The distribution of the similarity scores is summarized by using boxplots. The central box in each plot represents the inter-quartile range (IQR), which is defined as the difference between the 75th and 25th percentiles. The line in the middle of the box represents the median. Extreme values greater than 1.5 IQR above the 75th percentile and less than 1.5 IQR below the 25th percentile were plotted individually. Site identity was reasonably recovered with as few as 10 homeobox genes, which is better than with random subsets of 51 genes (compare to median score of 21 in B).
Figure 5
Figure 5
HOX expression in adult fibroblasts and the embryonic Hox code. Comparison of Hox expression pattern in secondary axes. Schematic of expression domains of 5′ HoxA genes in the mouse limb bud at approximately 11.5 days postcoitum is shown on top (after ref. 31). The HOX genes up-regulated in fibroblasts from the indicated sites are shown below.

Similar articles

Cited by

References

    1. Dhouailly D. In: Pattern Formation. Malincinski G, Bryant S, editors. New York: Macmillan; 1984. pp. 581–601.
    1. Yamaguchi Y, Itami S, Tarutani M, Hosokawa K, Miura H, Yoshikawa K. J Invest Dermatol. 1999;112:483–488. - PubMed
    1. Alizadeh A A, Eisen M B, Davis R E, Ma C, Lossos I S, Rosenwald A, Boldrick J C, Sabet H, Tran T, Yu X, et al. Nature (London) 2000;403:503–511. - PubMed
    1. Perou C M, Sorlie T, Eisen M B, van de Rijn M, Jeffrey S S, Rees C A, Pollack J R, Ross D T, Johnsen H, Akslen L A, et al. Nature (London) 2000;406:747–752. - PubMed
    1. Normand J, Karasek M A. In Vitro Cell Dev Biol Anim. 1995;31:447–455. - PubMed

Publication types