

High-resolution patterns of meiotic recombination across the human major histocompatibility complex
- PMID: 12297984
- PMCID: PMC378534
- DOI: 10.1086/342973
High-resolution patterns of meiotic recombination across the human major histocompatibility complex
Abstract
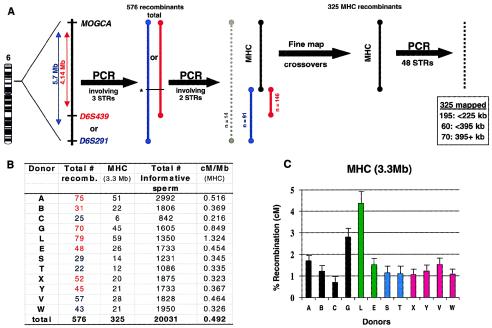
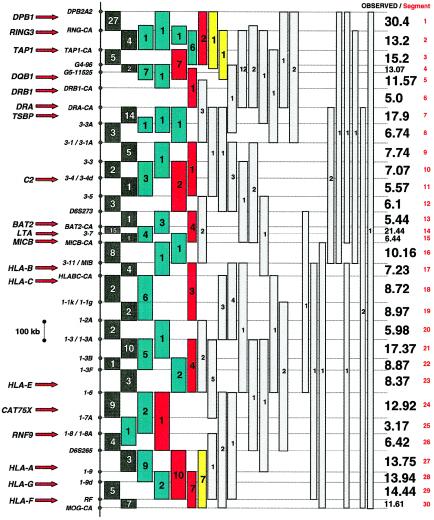
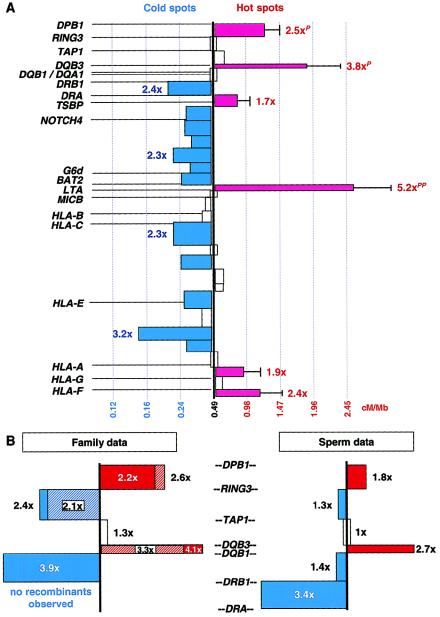
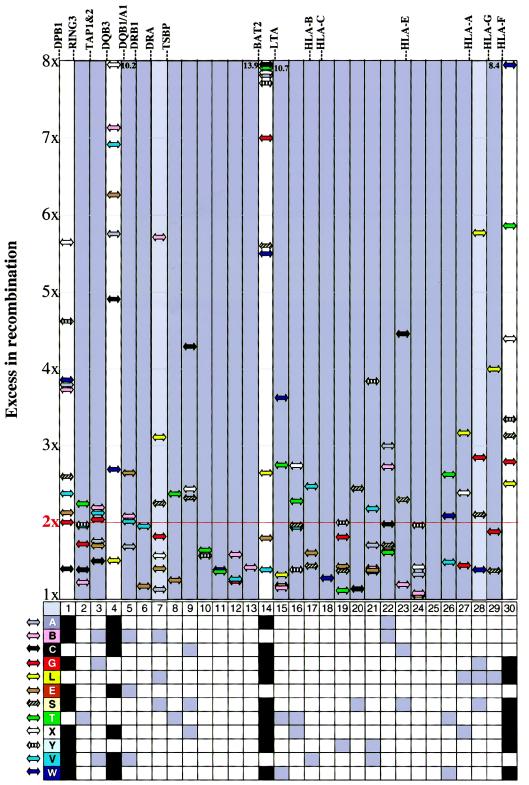
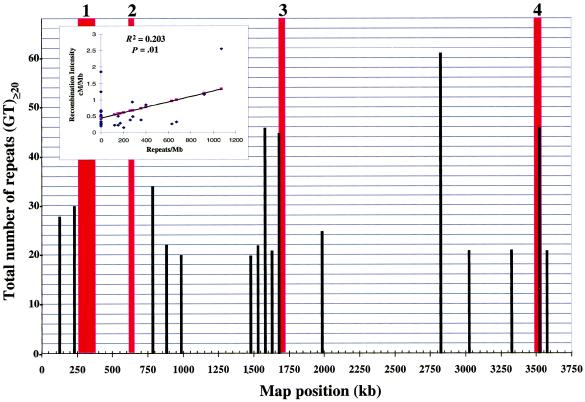
Definitive characteristics of meiotic recombination events over large (i.e., >1 Mb) segments of the human genome remain obscure, yet they are essential for establishing the haplotypic structure of the genome and for efficient mapping of complex traits. We present a high-resolution map of recombination at the kilobase level across a 3.3-Mb interval encompassing the major histocompatibility complex (MHC). Genotyping of 20,031 single sperm from 12 individuals resulted in the identification and fine mapping of 325 recombinant chromosomes within genomic intervals as small as 7 kb. Several principal characteristics of recombination in this region were observed: (1) rates of recombination can differ significantly between individuals; (2) intense hot spots of recombination occur at least every 0.8 Mb but are not necessarily evenly spaced; (3) distribution in the location of recombination events can differ significantly among individuals; (4) between hot spots, low levels of recombination occur fairly evenly across 100-kb segments, suggesting the presence of warm spots of recombination; and (5) specific sequence motifs associate significantly with recombination distribution. These data provide a plausible model for recombination patterns of the human genome overall.
Figures
Similar articles
-
Allele-dependent recombination frequency: homology requirement in meiotic recombination at the hot spot in the mouse major histocompatibility complex.Genomics. 1995 May 20;27(2):298-305. doi: 10.1006/geno.1995.1046. Genomics. 1995. PMID: 7557996
-
Meiotic recombinations within major histocompatibility complex of human embryos.Immunogenetics. 2012 Nov;64(11):839-44. doi: 10.1007/s00251-012-0644-y. Epub 2012 Aug 15. Immunogenetics. 2012. PMID: 22893033
-
Reciprocal crossover asymmetry and meiotic drive in a human recombination hot spot.Nat Genet. 2002 Jul;31(3):267-71. doi: 10.1038/ng910. Epub 2002 Jun 24. Nat Genet. 2002. PMID: 12089523
-
Molecular features of meiotic recombination hot spots.Bioessays. 2006 Jan;28(1):45-56. doi: 10.1002/bies.20349. Bioessays. 2006. PMID: 16369948 Review.
-
Meiotic recombination hot spots and human DNA diversity.Philos Trans R Soc Lond B Biol Sci. 2004 Jan 29;359(1441):141-52. doi: 10.1098/rstb.2003.1372. Philos Trans R Soc Lond B Biol Sci. 2004. PMID: 15065666 Free PMC article. Review.
Cited by
-
High-density map of short tandem repeats across the human major histocompatibility complex.Immunogenetics. 2003 Mar;54(12):900-10. doi: 10.1007/s00251-002-0535-8. Epub 2003 Feb 21. Immunogenetics. 2003. PMID: 12671742
-
Extended linkage disequilibrium surrounding the hemoglobin E variant due to malarial selection.Am J Hum Genet. 2004 Jun;74(6):1198-208. doi: 10.1086/421330. Epub 2004 Apr 27. Am J Hum Genet. 2004. PMID: 15114532 Free PMC article. Clinical Trial.
-
Initiation of meiotic recombination in mammals.Genes (Basel). 2010 Dec 22;1(3):521-49. doi: 10.3390/genes1030521. Genes (Basel). 2010. PMID: 24710101 Free PMC article.
-
Recombination rate variation in mice from an isolated island.Mol Ecol. 2017 Jan;26(2):457-470. doi: 10.1111/mec.13932. Epub 2016 Dec 21. Mol Ecol. 2017. PMID: 27864900 Free PMC article.
-
The Genomics of Elevated ALT and Adducts in Therapeutic Acetaminophen Treatment: a Pilot Study.J Med Toxicol. 2021 Apr;17(2):160-167. doi: 10.1007/s13181-020-00815-2. Epub 2020 Oct 13. J Med Toxicol. 2021. PMID: 33051802 Free PMC article.
References
Electronic-Database Information
-
- Human Genome at NCBI, http://www.ncbi.nlm.nih.gov/genome/guide/human/
-
- Sanger Institute: Human Chromosome 6 Home, http://www.sanger.ac.uk/HGP/Chr6/ (for the MHC sequence database)
References
-
- Aoki K, Suzuki K, Sugano T, Tasaka T, Nakahara K, Kuge O, Omori A, Kasai M (1995) A novel gene, Translin, encodes a recombination hotspot binding protein associated with chromosomal translocations. Nat Genet 10:167–174 - PubMed
-
- Badge RM, Yardley J, Jeffreys AJ, Armour JA (2000) Crossover breakpoint mapping identifies a subtelomeric hotspot for male meiotic recombination. Hum Mol Genet 9:1239–1244 - PubMed
-
- Beck S, Trowsdale J (2000) The human major histocompatibility complex: lessons from the DNA sequence. Annu Rev Genomics Hum Genet 1:117–137 - PubMed
-
- Begovich AB, McClure GR, Suraj VC, Helmuth RC, Fildes N, Bugawan TL, Erlich HA, Klitz W (1992) Polymorphism, recombination, and linkage disequilibrium within the HLA class II region. J Immunol 148:249–258 - PubMed
-
- Benger JC, Teshima I, Walter MA, Brubacher MG, Daouk GH, Cox DW (1991) Localization and genetic linkage of the human immunoglobulin heavy chain genes and the creatine kinase brain (CKB) gene: identification of a hot spot for recombination. Genomics 9:614–622 - PubMed
Publication types
MeSH terms
Grants and funding
LinkOut - more resources
Full Text Sources
Other Literature Sources
Research Materials
Miscellaneous
