

Fourier-transform infrared microspectroscopy, a novel and rapid tool for identification of yeasts
- PMID: 12324312
- PMCID: PMC126420
- DOI: 10.1128/AEM.68.10.4717-4721.2002
Fourier-transform infrared microspectroscopy, a novel and rapid tool for identification of yeasts
Abstract
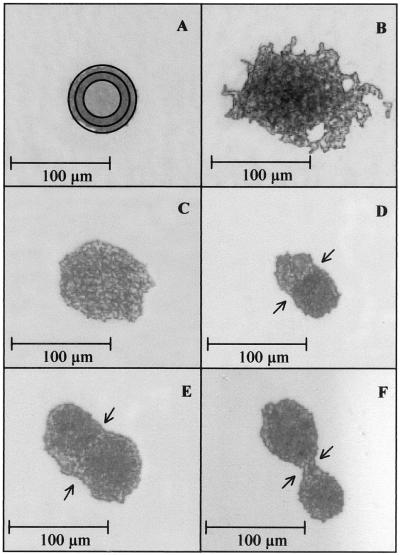
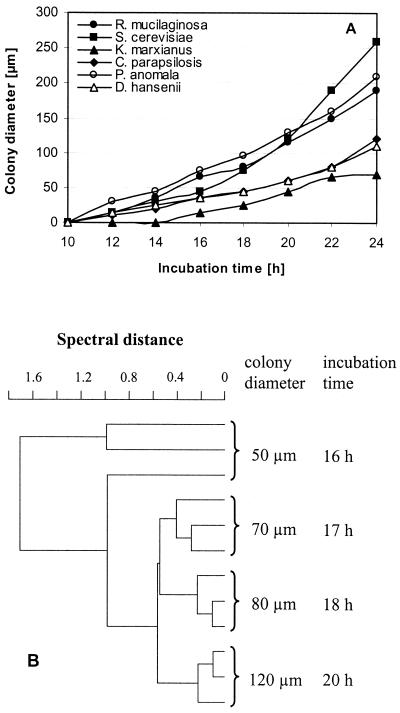
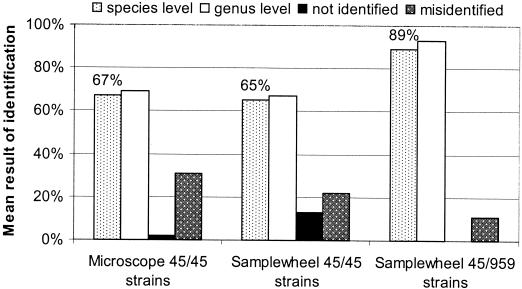
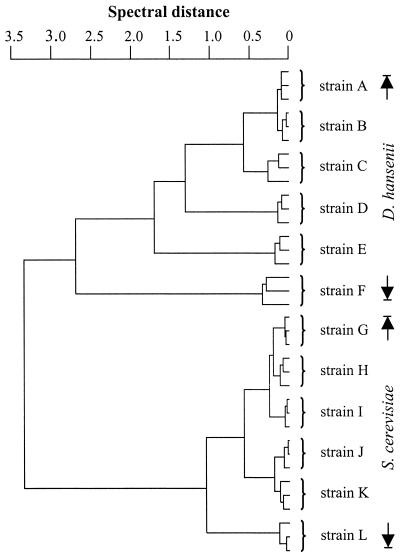
Fourier-transform infrared (FT-IR) microspectroscopy was used in this study to identify yeasts. Cells were grown to microcolonies of 70 to 250 micro m in diameter and transferred from the agar plate by replica stamping to an IR-transparent ZnSe carrier. IR spectra of the replicas on the carrier were recorded using an IR microscope coupled to an IR spectrometer, and identification was performed by comparison to reference spectra. The method was tested by using small model libraries comprising reference spectra of 45 strains from 9 genera and 13 species, recorded with both FT-IR microspectroscopy and FT-IR macrospectroscopy. The results show that identification by FT-IR microspectroscopy is equivalent to that achieved by FT-IR macrospectroscopy but the time-consuming isolation of the organisms prior to identification is not necessary. Therefore, this method also provides a rapid tool to analyze mixed populations. Furthermore, identification of 21 Debaryomyces hansenii and 9 Saccharomyces cerevisiae strains resulted in 92% correct identification at the strain level for S. cerevisiae and 91% for D. hansenii, which demonstrates that the resolution power of FT-IR microspectroscopy may also be used for yeast typing at the strain level.
Figures
Similar articles
-
Rapid and reliable identification of food-borne yeasts by Fourier-transform infrared spectroscopy.Appl Environ Microbiol. 1998 Jun;64(6):2207-14. doi: 10.1128/AEM.64.6.2207-2214.1998. Appl Environ Microbiol. 1998. PMID: 9603836 Free PMC article.
-
FT-IR microspectroscopy: a promising method for the rapid identification of Listeria species.FEMS Microbiol Lett. 2008 Jan;278(2):164-70. doi: 10.1111/j.1574-6968.2007.00995.x. Epub 2007 Dec 5. FEMS Microbiol Lett. 2008. PMID: 18053065
-
FT-IR spectroscopy: A powerful tool for studying the inter- and intraspecific biodiversity of cultivable non-Saccharomyces yeasts isolated from grape must.J Microbiol Methods. 2016 Feb;121:50-8. doi: 10.1016/j.mimet.2015.12.009. Epub 2015 Dec 12. J Microbiol Methods. 2016. PMID: 26688103
-
Rapid identification of Candida species by FT-IR microspectroscopy.Biochim Biophys Acta. 2005 Aug 5;1724(3):239-47. doi: 10.1016/j.bbagen.2005.04.019. Biochim Biophys Acta. 2005. PMID: 15951116 Review.
-
Biomedical investigations using Fourier transform-infrared microspectroscopy.Crit Rev Anal Chem. 2014;44(3):270-6. doi: 10.1080/10408347.2013.829389. Crit Rev Anal Chem. 2014. PMID: 25391565 Review.
Cited by
-
Identification of Grapholita molesta (Busk) (Lepidoptera: Tortricidae) Biotypes Using Infrared Spectroscopy.Neotrop Entomol. 2015 Apr;44(2):129-33. doi: 10.1007/s13744-015-0272-y. Epub 2015 Feb 18. Neotrop Entomol. 2015. PMID: 26013130
-
Reliable and rapid identification of Listeria monocytogenes and Listeria species by artificial neural network-based Fourier transform infrared spectroscopy.Appl Environ Microbiol. 2006 Feb;72(2):994-1000. doi: 10.1128/AEM.72.2.994-1000.2006. Appl Environ Microbiol. 2006. PMID: 16461640 Free PMC article.
-
Advances in Chemical and Biological Methods to Identify Microorganisms-From Past to Present.Microorganisms. 2019 May 13;7(5):130. doi: 10.3390/microorganisms7050130. Microorganisms. 2019. PMID: 31086084 Free PMC article. Review.
-
Identification of Yersinia enterocolitica at the species and subspecies levels by Fourier transform infrared spectroscopy.Appl Environ Microbiol. 2009 Sep;75(18):5809-13. doi: 10.1128/AEM.00206-09. Epub 2009 Jul 17. Appl Environ Microbiol. 2009. PMID: 19617388 Free PMC article.
-
Occurrence of Yeasts in White-Brined Cheeses: Methodologies for Identification, Spoilage Potential and Good Manufacturing Practices.Front Microbiol. 2020 Oct 15;11:582778. doi: 10.3389/fmicb.2020.582778. eCollection 2020. Front Microbiol. 2020. PMID: 33178163 Free PMC article. Review.
References
-
- Andrighetto, C., E. Psomas, N. Tzanetakis, G. Suzzi, and A. Lombardi. 2000. Randomly amplified polymorphic DNA (RAPD) PCR for the identification of yeasts isolated from dairy products. Lett. Appl. Microbiol. 30:5-9. - PubMed
-
- Augustyn, O. P. H., J. L. F. Kock, and D. Ferreira. 1992. Differentiation between yeast species and strains within a species by cellular fatty acid analysis. 5. A feasible technique? Syst. Appl. Microbiol. 15:105-115.
-
- Baleiras Couto, M. M., J. M. van der Vossen, H. Hofstra, and J. H. Huis in't Veld. 1994. RAPD analysis: a rapid technique for differentiation of spoilage yeasts. Int. J. Food Microbiol. 24:249-260. - PubMed
-
- Barnett, J. A., R. W. Payne, and D. Yarrow. 2000. Yeasts: characteristics and identification. Cambridge University Press, Cambridge, United Kingdom.
Publication types
MeSH terms
LinkOut - more resources
Full Text Sources
Other Literature Sources
Molecular Biology Databases
