Relationship between bacterial community composition and bottom-up versus top-down variables in four eutrophic shallow lakes
- PMID: 12324315
- PMCID: PMC126387
- DOI: 10.1128/AEM.68.10.4740-4750.2002
Relationship between bacterial community composition and bottom-up versus top-down variables in four eutrophic shallow lakes
Abstract
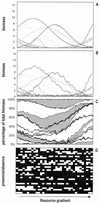
Bacterial community composition was monitored in four shallow eutrophic lakes during one year using denaturing gradient gel electrophoresis (DGGE) of PCR-amplified prokaryotic rDNA genes. Of the four lakes investigated, two were of the clearwater type and had dense stands of submerged macrophytes while two others were of the turbid type characterized by the occurrence of phytoplankton blooms. One turbid and one clearwater lake had high nutrient levels (total phosphorus, >100 micro g liter(-1)) while the other lakes had relatively low nutrient levels (total phosphorus, <100 micro g liter(-1)). For each lake, seasonal changes in the bacterial community were related to bottom-up (resources) and top-down (grazers) variables by using canonical correspondence analysis (CCA). Using an artificial model dataset to which potential sources of error associated with the use of relative band intensities in DGGE analysis were added, we found that preferential amplification of certain rDNA genes over others does not obscure the relationship between bacterial community composition and explanatory variables. Besides, using this artificial dataset as well as our own data, we found a better correlation between bacterial community composition and explanatory variables by using relative band intensities compared to using presence/absence data. While bacterial community composition was related to phytoplankton biomass in the high-nutrient lakes no such relation was found in the low-nutrient lakes, where the bacterial community is probably dependent on other organic matter sources. We used variation partitioning to evaluate top-down regulation of bacterial community composition after bottom-up regulation has been accounted for. Using this approach, we found no evidence for top-down regulation of bacterial community composition in the turbid lakes, while grazing by ciliates and daphnids (Daphnia and Ceriodaphnia) was significantly related to changes in the bacterial community in the clearwater lakes. Our results suggest that in eutrophic shallow lakes, seasonality of bacterial community structure is dependent on the dominant substrate source as well as on the food web structure.
Figures


References
-
- Acinas, S. G., F. Rodriguez-Valera, and C. Pedrosalio. 1997. Spatial and temporal variation in marine bacterioplankton diversity as shown by RFLP fingerprinting of PCR amplified 16s rDNA. FEMS Microbiol. Ecol. 24:27-40.
-
- Azam, F., T. Fenchel, J. G. Field, J. S. Gray, L. A. Meyer-Reil, and F. Thingstadt. 1983. The ecological role of water-column microbes in the sea. Mar. Ecol. Prog. Ser. 10:257-263.
-
- Baines, S. B., and M. L. Pace. 1991. The production of dissolved organic matter by phytoplankton and its importance to bacteria—patterns across marine and fresh-water systems. Limnol. Oceanogr. 36:1078-1090.
-
- Bano, N., M. A. Moran, and R. E. Hodson. 1997. Bacterial utilization of dissolved humic substances from a freshwater swamp. Aquat. Microb. Ecol. 12:233-238.
-
- Bernard, L., C. Courties, P. Servais, M. Troussellier, M. Petit, and P. Lebaron. 2000. Relationships among bacterial cell size, productivity, and genetic diversity in aquatic environments using cell sorting and flow cytometry. Microb. Ecol. 40:148-158. - PubMed
Publication types
MeSH terms
Substances
LinkOut - more resources
Full Text Sources
Other Literature Sources

