. 2002 Oct;68(10):4986-95.
doi: 10.1128/AEM.68.10.4986-4995.2002.

Culture-independent microbial community analysis reveals that inulin in the diet primarily affects previously unknown bacteria in the mouse cecum

Affiliations

Culture-independent microbial community analysis reveals that inulin in the diet primarily affects previously unknown bacteria in the mouse cecum

Juha H A Apajalahti et al. Appl Environ Microbiol. 2002 Oct.

Abstract

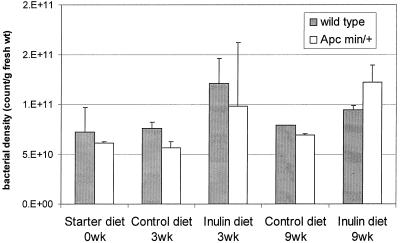
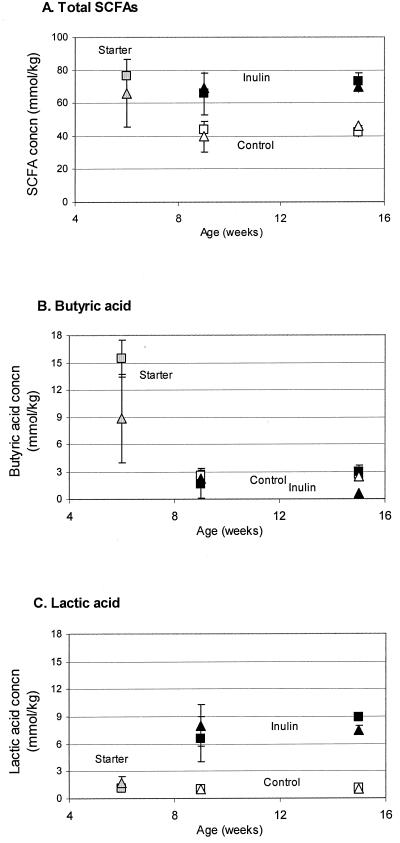
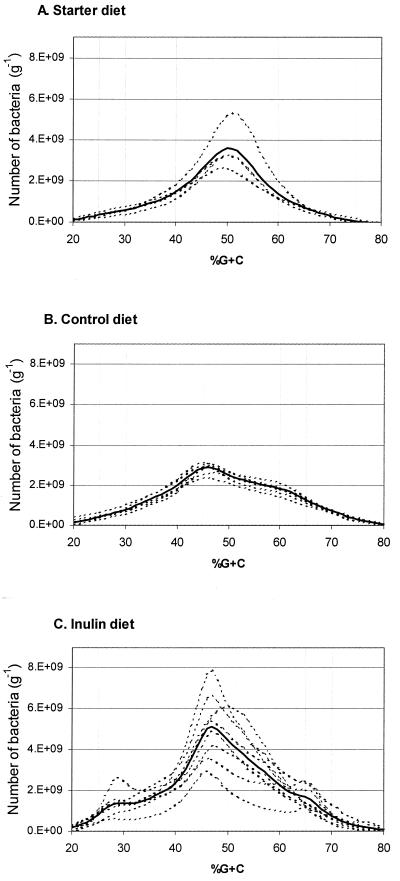
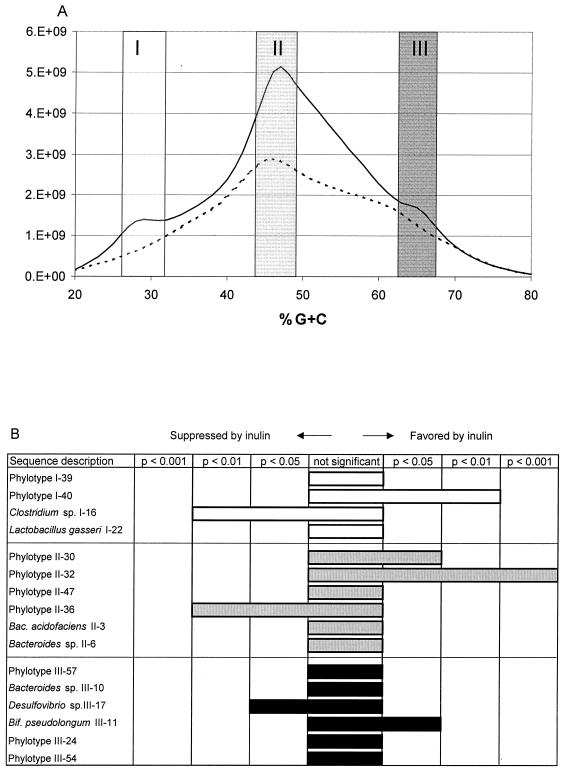
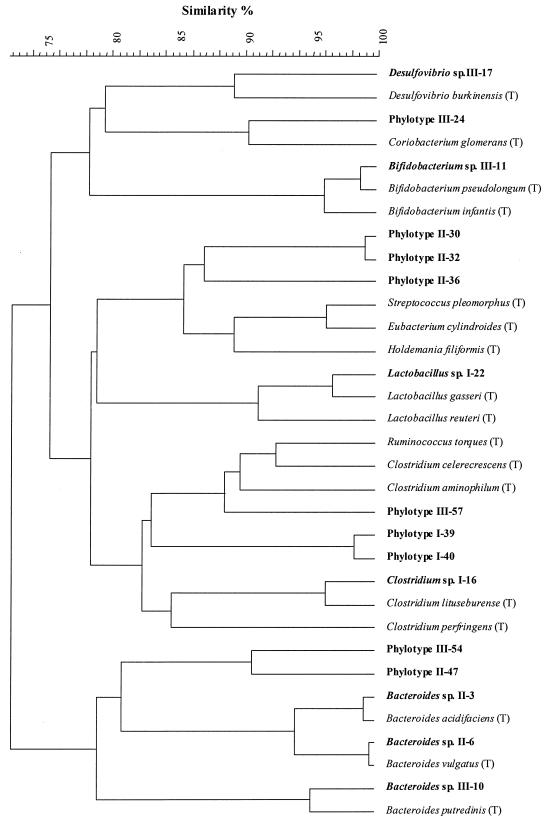
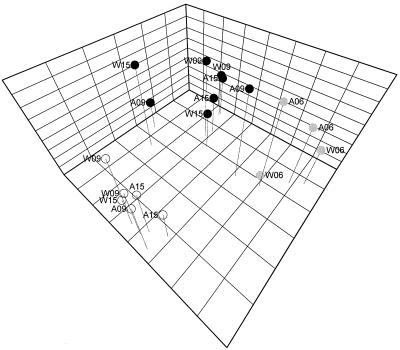
Inulin is a well-known fructose-based prebiotic which has been shown to stimulate the growth of bifidobacteria, a bacterial group generally considered beneficial for intestinal health. In the present study, we analyzed inulin-associated shifts in the total bacterial community of wild-type mice and mice carrying a genetically inactivated adenomatous polyposis coli tumor suppressor gene by using DNA-based approaches independent of bacterial culturability. Mice were fed a high-fat, nonfiber diet with or without inulin inclusion at a 10% (wt/wt) concentration. Cecal contents were analyzed after 0, 3, and 9 weeks on the experimental diets. Inulin inclusion significantly affected the total bacterial community structure of the cecum as determined by both a nonselective percent-guanine-plus-cytosine-based profiling analysis and a more specific 16S ribosomal DNA sequence analysis. The shifts included stimulation of bifidobacteria and suppression of clostridia, but sequence comparison revealed that the major shifts were within previously unknown bacterial taxa. Concomitantly, significantly higher bacterial densities, determined by flow cytometry, were observed with the inulin-amended diet, and the metabolism of the cecal bacterial community was altered, as indicated by higher levels of residual short-chain fatty acids, particularly lactic acid. With regard to all of the microbiological parameters measured, the wild-type mice and mice carrying a genetically inactivated adenomatous polyposis coli tumor suppressor gene were essentially identical. Studies of the implications of pre- and probiotics may need to be expanded to include careful analysis of their effects on the entire microbial community, rather than just a few well-known species. Further studies are needed to increase our understanding of the possible roles of currently unknown gastrointestinal bacteria in health and disease.


Figures

FIG. 1.
FIG. 1.
Effects of diet on total bacterial densities in the ceca of wild-type and ApcMin/+ mice. Bacterial densities in the ceca of wild-type and ApcMin/+ mice were determined by flow cytometry before the animals were transferred to the experimental diets at the age of 6 weeks (Starter diet 0 wk) and again after 3 and 9 weeks on the experimental diets (Control diet and Inulin diet). Bacterial densities are shown in shaded columns for wild-type mice and in white columns for ApcMin/+ mice. Each column represents two pools of 8 to 12 animals. Error bars show ± standard errors of the means.
FIG. 2.
FIG. 2.
Effects of diet on cecal concentrations of short-chain fatty acids. Residual concentrations of short-chain fatty acids in the ceca of wild type and ApcMin/+ mice were analyzed by gas chromatography following the sampling scheme described in the legend of Fig. 1. (A) Concentration of total short-chain fatty acids; (B) concentration of butyric acid; (C) concentration of lactic acid. Colors of the symbols indicate different diets (gray, starter diet; white, control diet; black, inulin diet), and the shapes of symbols indicate the genetic backgrounds of the mice (triangle, wild type; square, ApcMin/+). Each data point represents two pools of 8 to 12 animals. Error bars show ± standard errors of the means.
FIG. 3.
FIG. 3.
Percent G+C profiles of cecal bacterial communities in mice on different diets. (A) Four cecal bacterial profiles each representing pools of digesta from 8 to 12 animals on the starter diet. (B) Six cecal bacterial profiles each representing pools of digesta from 8 to 12 animals on the control diet. (C) Eight cecal bacterial profiles each representing pools of digesta from 8 to 12 animals on the inulin diet. Dotted lines, profiles of individual pools; solid lines, average profile on a specified diet.
FIG. 4.
FIG. 4.
16S rDNA sequence analysis from %G+C fractions characteristic of the inulin diets. (A) Pooled %G+C profiles of all mice on the control diet (dotted line) and all mice on the inulin diet (solid line). Vertical columns show the fractions of DNA selected for 16S rDNA-based analysis from each profile. Fractions corresponded to 27 to 32% G+C (I), 44 to 49% G+C (II), and 63 to 68% G+C (III). (B) The effects of inulin on the abundance of dominant phylotypes were determined for all sequence phylotypes represented at least twice. The outcome is represented as a confidence plot where each phylotype is considered to be suppressed, show no significant effect, or be favored by inulin, with the corresponding confidence interval indicated (refer to Materials and Methods). White bars, phylotypes in fraction I of panel A; gray bars, phylotypes in fraction II of panel A; black bars, phylotypes in fraction III of panel A.
FIG. 5.
FIG. 5.
Phylogenetic analysis of the most abundant bacterial phylotypes inhabiting the mouse cecum. The bacterial phylotypes shown in Fig. 4B were subjected to phylogenetic analysis together with the type strains of some known intestinal bacteria whose 16S rDNA sequences were obtained from the RDP II sequence database (31). Type strains are indicated by (T) after the species name, and phylotypes found in the present study are indicated by boldface type. Prefixes I, II, and III in strain numbers indicate the fraction of %G+C profile from which the phylotype originates. I, low %G+C; II, medium %G+C; III, high %G+C.
FIG. 6.
FIG. 6.
Principal-component analysis of the bacterial parameters. Each data point in the graph represents a pool of 8 to 12 mice, whose genetic backgrounds and ages are indicated in the labels next to each symbol. W, wild type; A, Apcmin/+; 06, 09, and 15, age of 6, 9, and 15 weeks, respectively. Clustering of the data points is based on SCFA, bacterial density, and %G+C analyses. The color of each symbol indicates the type of diet as follows: gray, starter diet; white, control diet; black, inulin diet.

References

    1. Afifi, A. A., and V. Clark. 1990. Principal component analysis, p. 371-394. In A. A. Afifi and V. Clark (ed.), Computer-aided multivariate analysis. Chapman & Hall, New York, N.Y.
    1. Amann, R. I., W. Ludwig, and K. H. Schleifer. 1995. Phylogenetic identification and in situ detection of individual microbial cells without cultivation. Microbiol. Rev. 59:143-169. - PMC - PubMed
    1. Apajalahti, J. H. A., L. K. Sarkilahti, B. R. Maki, J. P. Heikkinen, P. H. Nurminen, and W. E. Holben. 1998. Effective recovery of bacterial DNA and percent-guanine-plus-cytosine-based analysis of community structure in the gastrointestinal tract of broiler chickens. Appl. Environ. Microbiol. 64:4084-4088. - PMC - PubMed
    1. Apajalahti, J. H. A., A. Kettunen, M. R. Bedford, and W. E. Holben. 2001. Percent G+C profiling accurately reveals diet-related differences in the gastrointestinal microbial community of broiler chickens. Appl. Env. Microbiol. 67:5656-5667. - PMC - PubMed
    1. Bouhnik, Y., B. Flourie, M. Riottot, N. Bisetti, M. F. Gailing, A. Guibert, F. Bornet, and J. C. Rambaud. 1996. Effects of fructo-oligosaccharides ingestion on fecal bifidobacteria and selected metabolic indexes of colon carcinogenesis in healthy humans. Nutr. Cancer 26:21-29. - PubMed

Publication types

LinkOut - more resources