. 2002 Oct 1;22(19):8553-62.
doi: 10.1523/JNEUROSCI.22-19-08553.2002.

Cyclin-dependent kinase-2 controls oligodendrocyte progenitor cell cycle progression and is downregulated in adult oligodendrocyte progenitors

Affiliations

Cyclin-dependent kinase-2 controls oligodendrocyte progenitor cell cycle progression and is downregulated in adult oligodendrocyte progenitors

Shibeshih Belachew et al. J Neurosci. .

Abstract

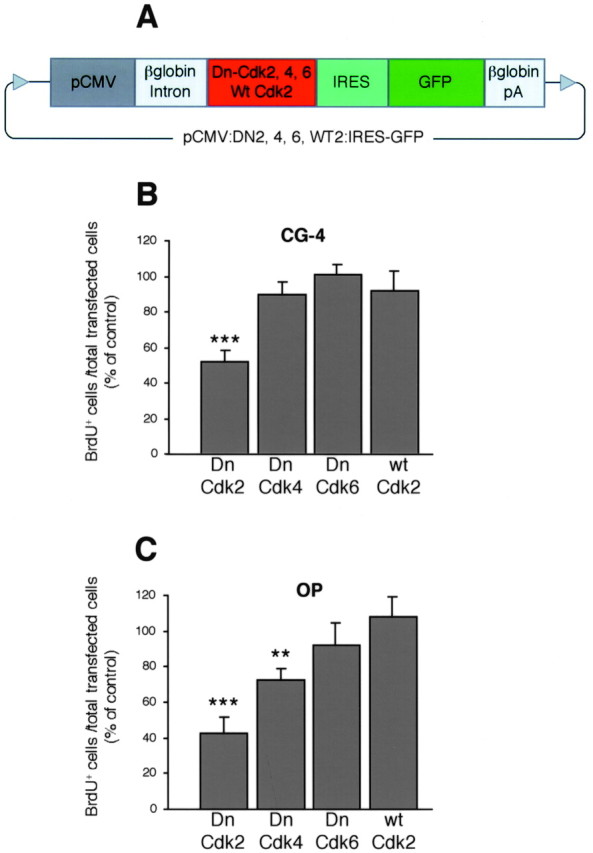
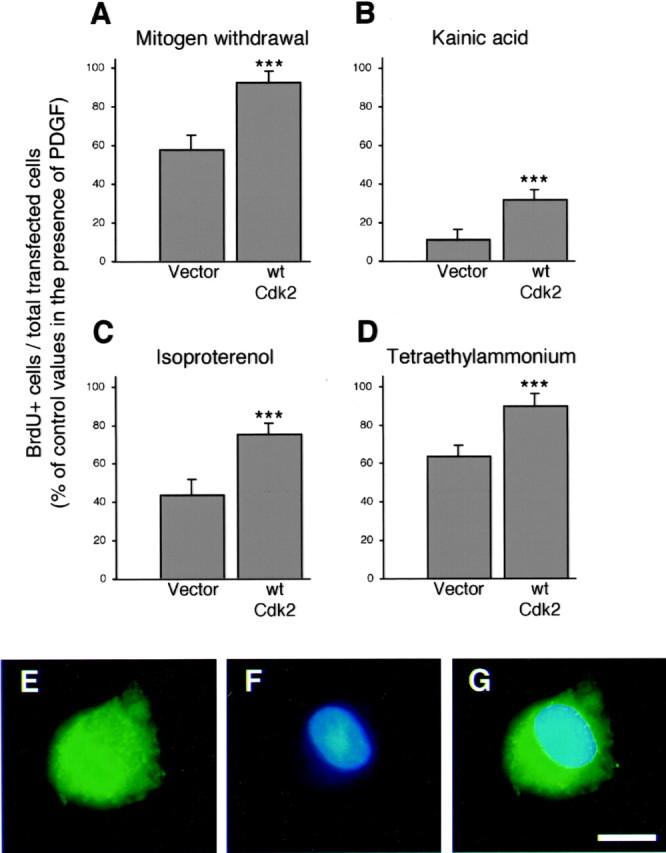
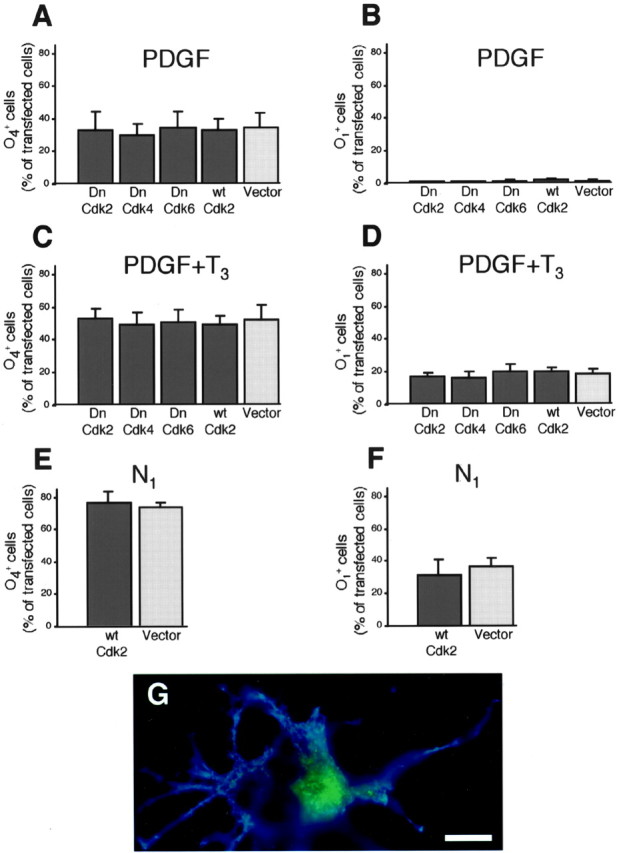
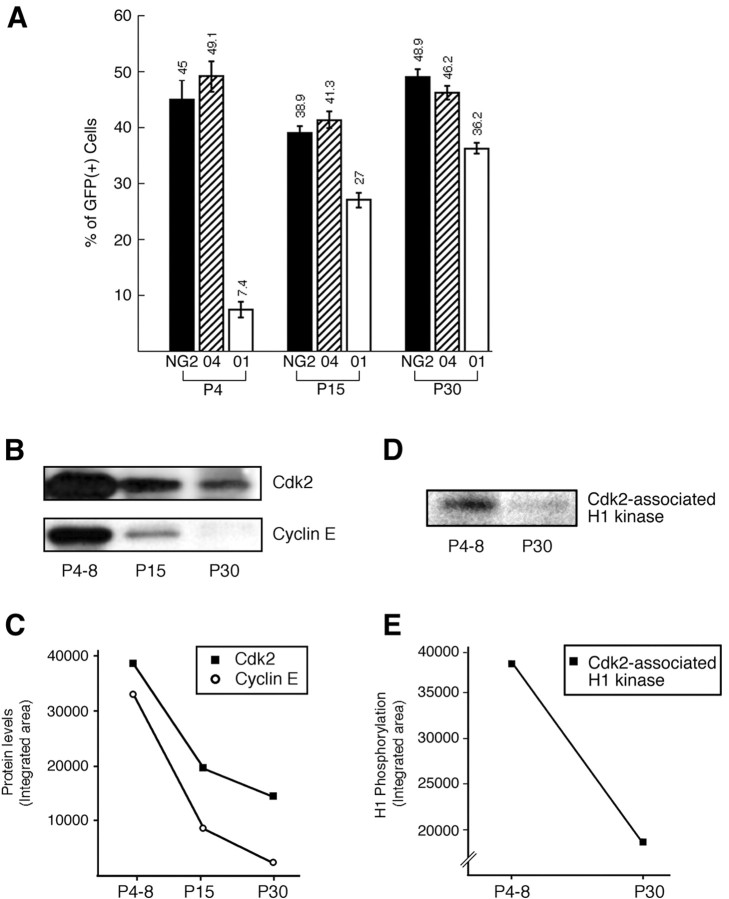
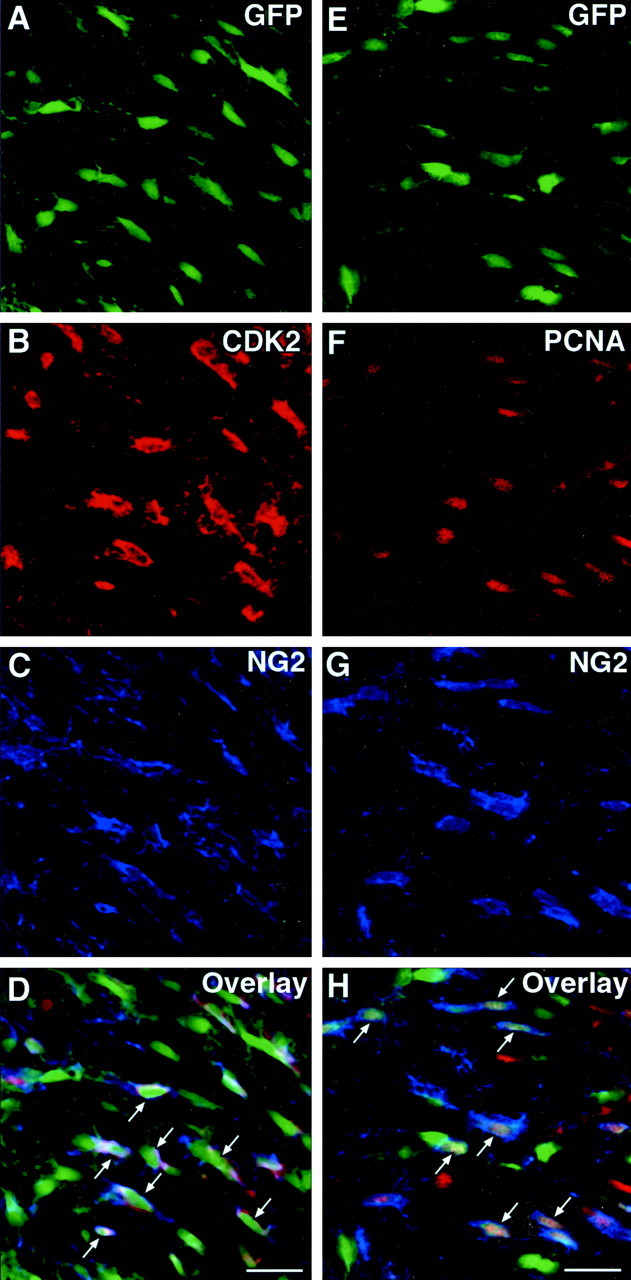
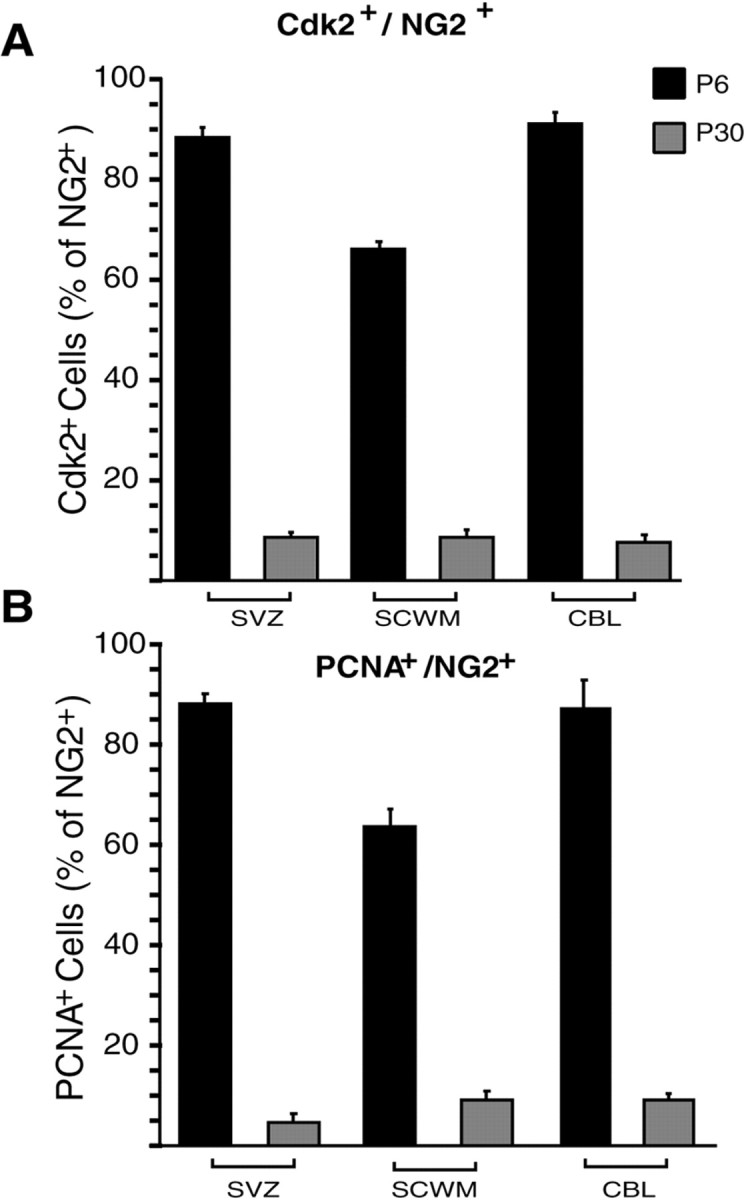
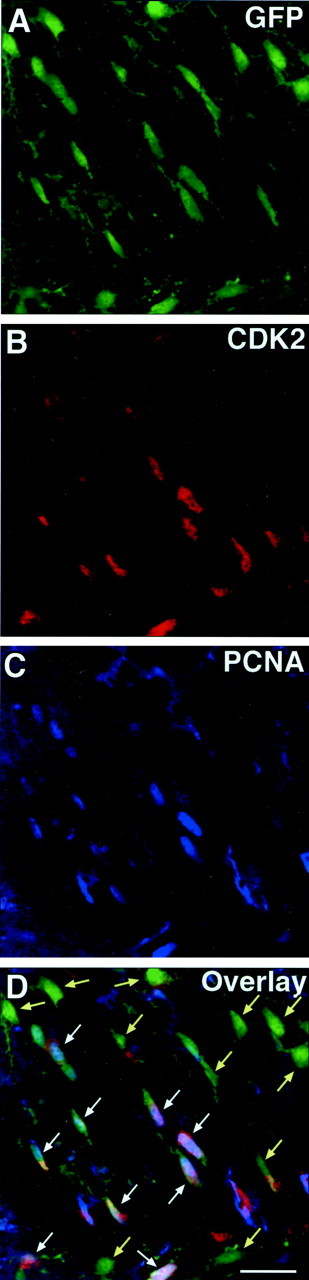
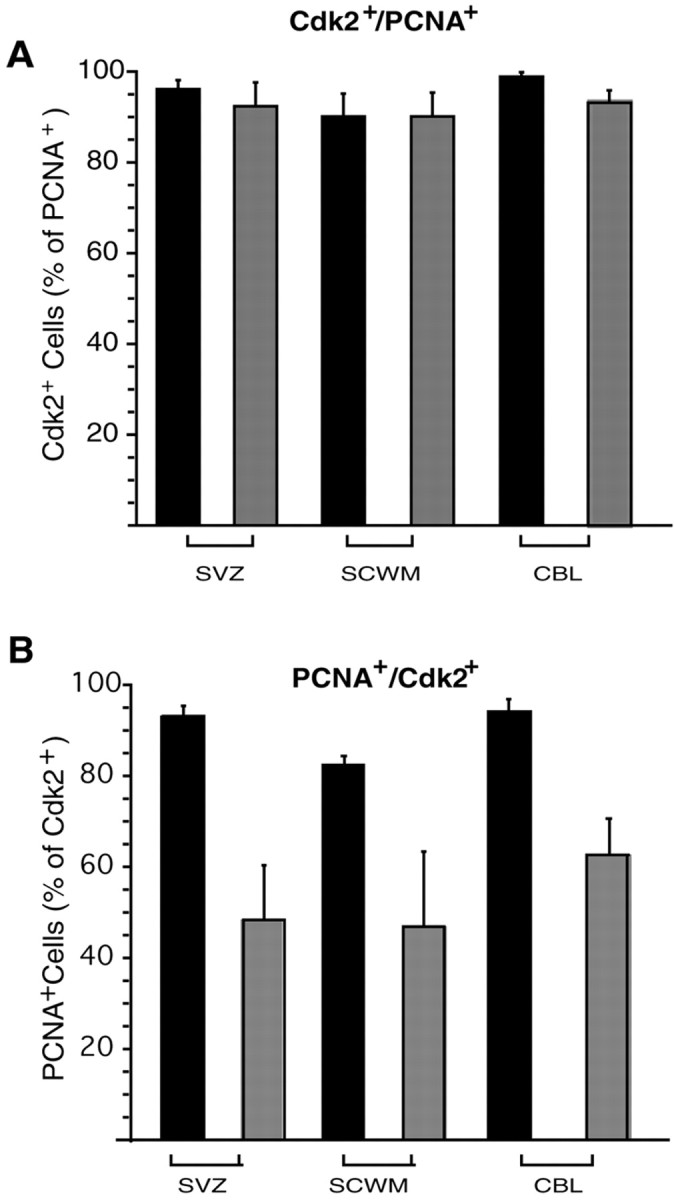
Proliferation of oligodendrocyte progenitor (OP) cells is a crucial process controlling myelination in the CNS. Previous studies demonstrated a correlation between OP proliferation rate and cyclin E/cyclin-dependent kinase-2 (cdk2) activity. To establish a causal link between cyclin E/cdk2 activity and OP proliferation, we selectively modulated cdk2 activity in vitro by transfection of cultured OP cells. Dominant-negative (Dn)-cdk2 overexpression inhibited mitogen-induced OP cell proliferation, whereas wild-type (wt)-cdk2 prevented cell cycle arrest caused by anti-mitotic signals. Dn-cdk2- or wt-cdk2-mediated regulation of G(1)/S transition, per se, did not influence initiation of OP differentiation. To study the function of cyclin E/cdk2 in OP cells during development in vivo, we analyzed cdk2 and cyclin E expression in cells acutely isolated from transgenic mice expressing the green fluorescent protein (GFP) under the control of the 2'-3'-cyclic nucleotide 3'-phosphodiesterase gene promoter. Both cyclin E/cdk2 protein levels and activity were decreased in GFP(+) oligodendrocyte lineage cells between postnatal days 4 and 30. Immunostaining of NG2(+)/GFP(+) OP cells in brain tissue sections showed a 90% decrease in overall cell proliferation and cdk2 expression between perinatal and adult cells. However, cdk2 expression within the proliferating (i.e., expressing the proliferating cell nuclear antigen) OP cell population was maintained throughout development. Our data indicate that: (1) cyclin E/cdk2 activity plays a pivotal function in OP cell cycle decisions occurring at G(1)/S checkpoint; (2) initiation of OP differentiation is independent of cyclinE/cdk2 checkpoint, and (3) intrinsic differences in cyclin E/cdk2 expression and activity may underlie the slowly proliferative state that characterizes so-called "quiescent" adult OP cells in vivo.


Figures

Fig. 1.
Fig. 1.
Cdk2 is a crucial mediator of mitogen-induced OP cell cycle progression. A, Several plasmid constructions (pCMV:DN2, 4, 6, WT2:IRES-GFP, 8.8–8.9 kb) carrying cDNAs for the wild-type cdk2 or dominant-negative mutants of cdk2, 4, and 6, under the control of the CMV promoter were generated. The GFP was used as reporter gene and was cloned downstream of an IRES, allowing GFP to be synthesized without fusing with the different kinase proteins. The control vector (pCMV:IRES-GFP, 7.9 kb) only contained the IRES–GFP directly driven by the CMV promoter. The plasmids also encompassed the β-globin intron to enhance transgene expression, and the β-globin polyadenylation (pA) sequence. B, C,Transfected CG-4 and OP cells were cultured in mitogenic medium (see Materials and Methods) and stained after incorporating BrdU (20 μm) from 24 to 42 hr post-end of transfection. The BrdU incorporation index (= BrdU+ cells/total transfected GFP+ cells) for cells overexpressing the different Dn- and wt-cdks is expressed as a percentage of the corresponding values obtained for cells transfected with the pCMV:IRES-GFP control vector, which were 62.6 ± 3% for primary OP cells and 90.4 ± 5% for CG-4 cells (mean ± SEM). Dn-cdk2 overexpression induced cell cycle arrest both in primary OP and CG-4 cells, whereas Dn-cdk4 marginally inhibited proliferation only in primary OP cells. Histograms represent mean ± SEM of counts from three separate experiments (>1000 GFP+ cells counted for each condition, triplicate coverslips for each). **p < 0.01, ***p < 0.001, Student's ttest.
Fig. 2.
Fig. 2.
Wt-cdk2 overexpression reverted OP cell cycle arrest associated with the activation of glutamatergic and β-adrenergic receptors, K+ channels blockade, or mitogen starvation. After transfection, primary OP cells were placed in DME-N1 plus PDGF (10 ng/ml). Twenty-four hours after end of transfection, OP cells were either shifted to growth factor free DME-N1 (A), or maintained in PDGF-containing medium supplemented with the glutamate receptor agonist kainic acid (100 μm) (B), the β-adrenergic agonist isoproterenol (50 μm) (C), or K+ channel blocker tetraethylammonium (5 mm) (D). Two hours after the medium change, OP cells were incubated with BrdU (20 μm) for the next 18 hr. Cells transfected with pCMV:WT2:IRES-GFP were compared with those transfected with pCMV:IRES-GFP control vector. Each BrdU incorporation index is expressed as a percentage of values obtained with cells that were transfected with the same constructs, but cultured in the presence of PDGF alone during the entire duration of the experiment. Histograms represent mean ± SEM of counts (total GFP+cells counted ranged between 539 and 885 for each condition) from two independent experiments with triplicate coverslips each. ***p < 0.001, Student's t test. Separate (GFP in E and BrdU staining inF) and merged (G) fluorescence views of a proliferating pCMV:WT2:IRES-GFP-transfected OP cell cultured in growth factor free DME-N1. Scale bar, 7 μm.
Fig. 3.
Fig. 3.
Cdk2-mediated regulation of OP cell cycle kinetics does not affect differentiation. O4 and O1immunophenotypes were assessed 4 d after transfection (pCMV:DN2, 4, 6, WT2:IRES-GFP and pCMV:IRES-GFP) of OP cells kept in a mitogenic environment (DME-N1 plus PDGF 10 ng/ml) with (C, D) or without (A, B) tri-iodothyronine (T3; 50 ng/ml). Conversely, we also analyzed O4 and O1 emergence 4 d after transfecting (pCMV:IRES-GFP versus pCMV:WT2:IRES-GFP) OP cells that had been transferred into cell cycle arresting conditions (i.e., DME-N1), 24 hr after end of transfection (E, F). G, Double fluorescence view of an O1+ (blue) mature oligodendrocyte overexpressing wt-cdk2 (GFP in green). Scale bar, 7 μm. Histograms represent mean ± SEM of counts (total GFP+ cells counted ranged between 427 and 1106 for each condition) from three independent experiments with triplicate coverslips each.
Fig. 4.
Fig. 4.
Cyclin E/cdk2 levels and activity decrease in oligodendroglial cells during development in vivo.A, Immunophenotype of acutely isolated CNP-GFP+ oligodendroglial cells after FACS purification. We previously demonstrated that GFP expression in CNP–GFP transgenic mice was restricted to oligodendrocyte lineage cells (Belachew et al., 2001; Yuan et al., 2002), and that the FACS procedure resulted in a 100% pure population of GFP+ cells whose antigenic properties were identical to those in vivo (Yuan et al., 2002). Values represent the percentage (mean ± SEM) of NG2+, O4+, and O1+ cells in FAC-sorted cell suspensions derived from P4, P15, and P30 CNP–GFP transgenic mice. Total cells counted ranged from 652 to 2185 for each condition. B,Western blot analysis of cdk2 and cyclin E expression was performed with samples containing pure oligodendroglial cells freshly isolated from postnatal P4–P8, P15, and P30 brains. Samples were obtained by FACS of GFP+ cells from CNP–GFP transgenic mice. FAC-sorted cells were pooled from a total of 15 brains for each experimental time point. C, Values were determined by densitometric analysis of the autoradiographs shown in Band are expressed in arbitrary units. D, Cdk2-associated histone H1-kinase activity was measured in FACS-purified CNP–GFP+ cells at P4–P8 and P30, as previously described (Ghiani and Gallo, 2001). Western blot FAC-sorted cells were pooled from a total of 15 brains for each experimental time point.E, Values were determined by densitometric analysis of the autoradiograph shown in D and are expressed in arbitrary units.
Fig. 5.
Fig. 5.
The majority of perinatal NG2+OP cells are proliferative and express cdk2 in vivo. Brain sections of SVZ from P6 CNP–GFP mice were immunostained with either (A–D, representing the same field) NG2 (blue) and anti-cdk2 (red) antibodies, or (E–H, representing the same field) with NG2 (blue) and anti-PCNA (red) antibodies. Images were obtained from the subventricular zone. At P6, the majority of GFP+/NG2+ cells were also stained with anti-cdk2 (A–D, arrows inD) or with anti-PCNA antibodies (E–H, arrows in H) (see Fig. 6 for quantitation). Scale bar, 20 μm.
Fig. 6.
Fig. 6.
Cdk2 expression and cell proliferation are downregulated between perinatal and adult oligodendrocyte progenitor cells. Subventricular zone (SVZ), subcortical white matter (SCWM), and cerebellar white matter (CBL) from CNP–GFP mice were analyzed by immunostaining at P6 and P30, to assess the number of cdk2- (A) and PCNA-expressing (B) cells within the NG2+/GFP+ population at distinct developmental stages. Histograms represent mean ± SEM. Total GFP+ cells counted ranged between 483 and 641 at P6, and between 409 and 455 at P30.
Fig. 7.
Fig. 7.
Coexpression of PCNA and cdk2 in CNP-GFP+ cells in vivo. Brain sections from P6 CNP–GFP mice A–D, representing the same field were immunostained with anti-cdk2 (B, red) and anti-PCNA (C, blue) antibodies. Images represent the same microscopic field obtained from the subventricular zone at P6. The majority of proliferating PCNA+/GFP+ oligodendroglial cells coexpressed cdk2 (white arrows; see Fig. 8 for quantitation), whereas most of the cdk2-negative oligodendroglial cells were found to be nonproliferative, i.e., PCNA-negative (yellow arrows). Scale bar, 20 μm.
Fig. 8.
Fig. 8.
Proliferating GFP+oligodendroglial cells express sustained levels of cdk2 during development. Subventricular zone (SVZ), subcortical white matter (SCWM), and cerebellar white matter (CBL) from CNP–GFP mice were analyzed by immunostaining at P6 and P30, to assess the number of PCNA- and cdk2-co-expressing cells within the GFP+ population at distinct developmental stages. A shows the percentage of PCNA+ cells also expressing cdk2, whereasB indicates the percentage of cdk2+cells also expressing PCNA. Histograms represent mean ± SEM. Total GFP+ cells counted ranged between 483 and 597 at P6 and between 409 and 455 at P30.

Similar articles

Cited by

References

    1. Belachew S, Yuan X, Gallo V. Unraveling oligodendrocyte origin and function by cell-specific transgenesis. Dev Neurosci. 2001;23:287–298. - PubMed
    1. Bergles DE, Roberts JD, Somogyi P, Jahr CE. Glutamatergic synapses on oligodendrocyte precursor cells in the hippocampus. Nature. 2000;405:187–191. - PubMed
    1. Calver AR, Hall AC, Yu WP, Walsh FS, Heath JK, Betsholtz C, Richardson WD. Oligodendrocyte population dynamics and the role of PDGF in vivo. Neuron. 1998;20:869–882. - PubMed
    1. Chan CL, Wigley CB, Berry M. Oligodendrocyte-type 2 astrocyte (O-2A) progenitor cells from neonatal and adult rat optic nerve differ in their responsiveness to platelet-derived growth factor. Brain Res Dev Brain Res. 1990;55:275–282. - PubMed
    1. Chang A, Nishiyama A, Peterson J, Prineas J, Trapp BD. NG2-positive oligodendrocyte progenitor cells in adult human brain and multiple sclerosis lesions. J Neurosci. 2000;20:6404–6412. - PMC - PubMed

Publication types

MeSH terms