. 2002 Oct 1;22(19):8563-73.
doi: 10.1523/JNEUROSCI.22-19-08563.2002.

Frizzled-3 is required for the development of major fiber tracts in the rostral CNS

Affiliations

Frizzled-3 is required for the development of major fiber tracts in the rostral CNS

Yanshu Wang et al. J Neurosci. .

Abstract

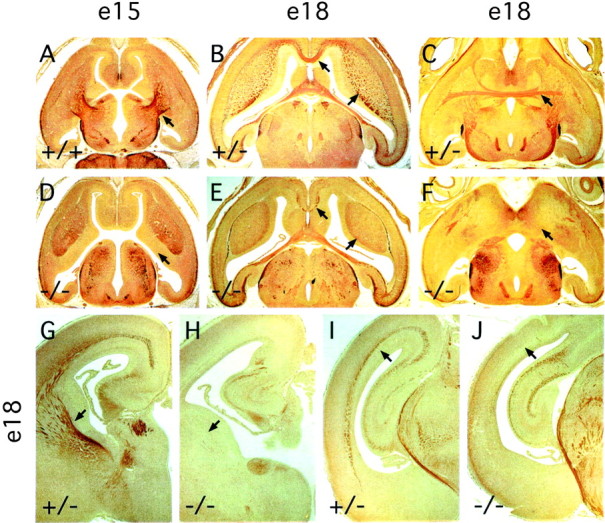
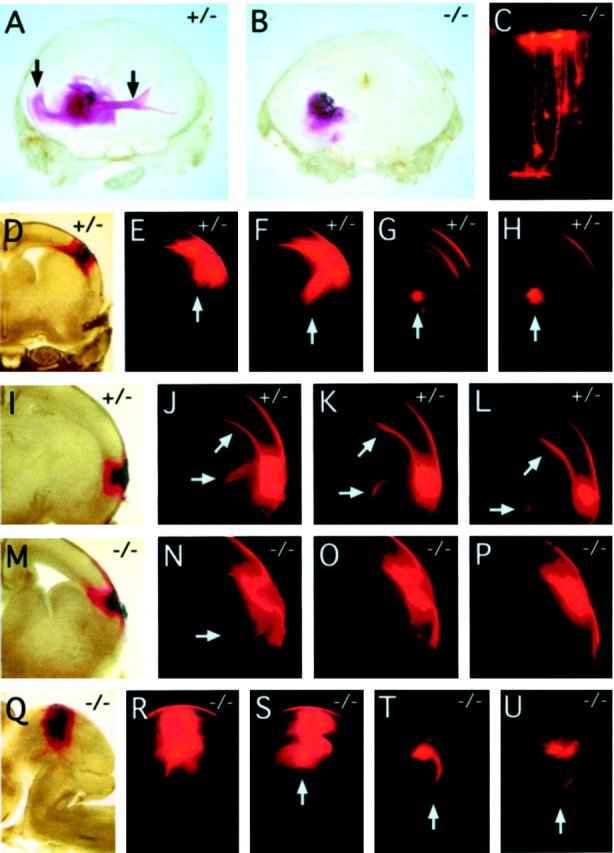
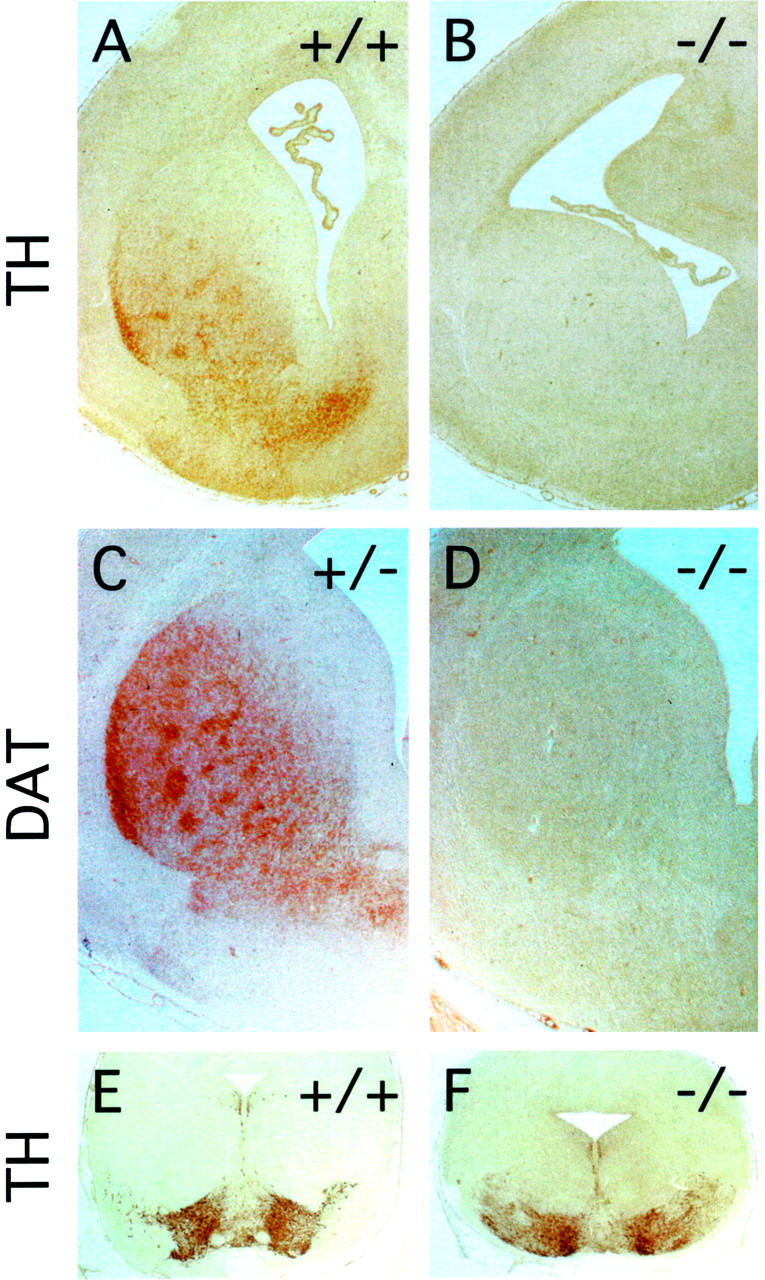
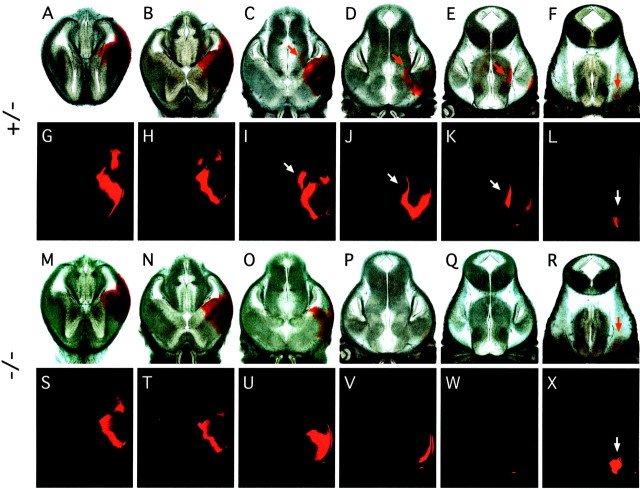
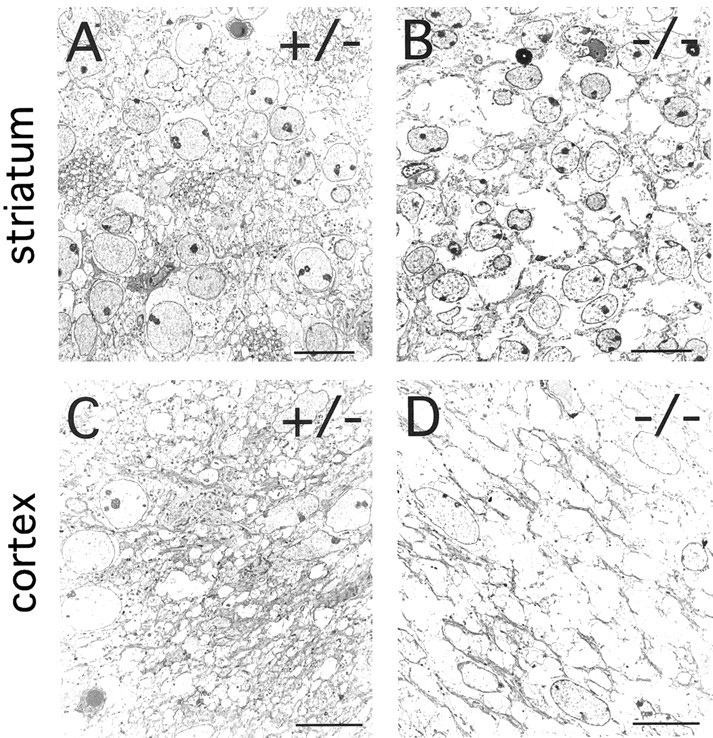
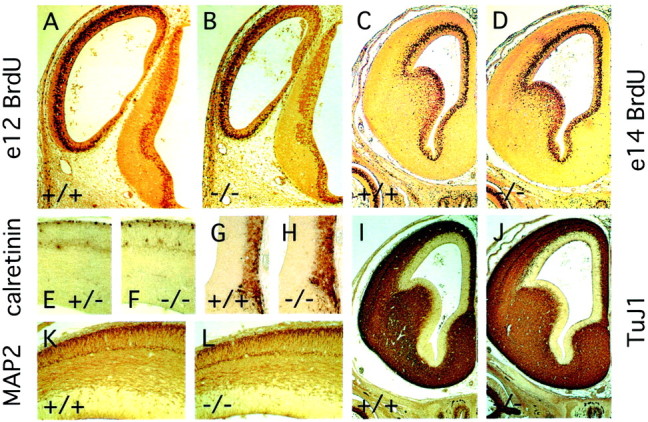
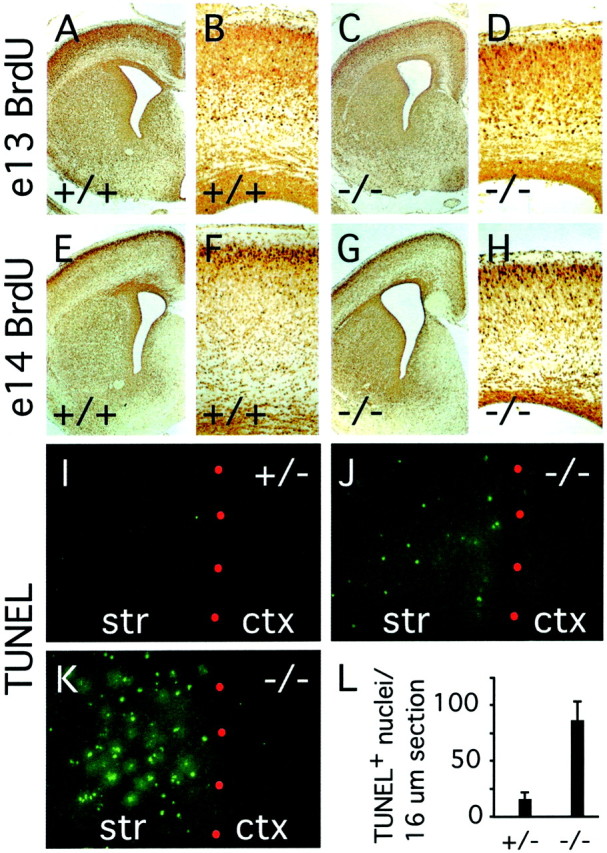
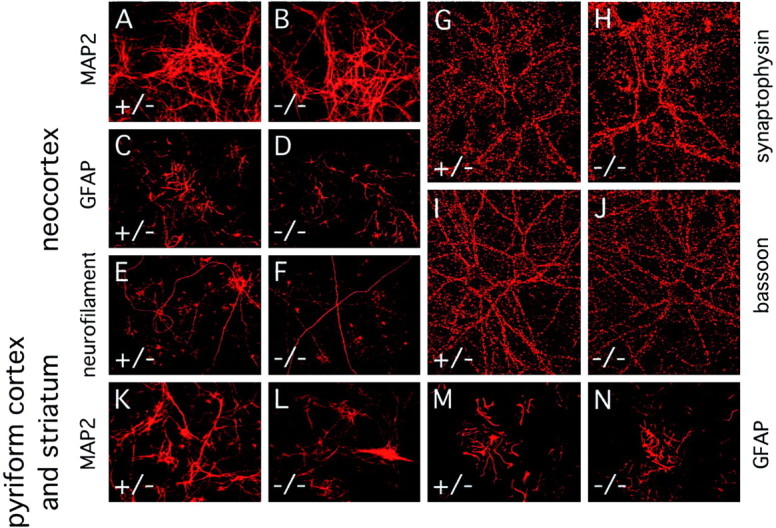
Many ligand/receptor families are known to contribute to axonal growth and targeting. Thus far, there have been no reports implicating Wnts and Frizzleds in this process, despite their large numbers and widespread expression within the CNS. In this study, we show that targeted deletion of the mouse fz3 gene leads to severe defects in several major axon tracts within the forebrain. In particular, fz3(-/-) mice show a complete loss of the thalamocortical, corticothalamic, and nigrostriatal tracts and of the anterior commissure, and they show a variable loss of the corpus callosum. Peripheral nerve fibers and major axon tracts in the more caudal regions of the CNS are mostly or completely unaffected. Cell proliferation in the ventricular zone and cell migration to the developing cortex proceed normally until at least embryonic day 14. Extensive cell death in the fz3(-/-) striatum occurs late in gestation, perhaps secondary to the nearly complete absence of long-range connections. In contrast, there is little cell death, as assayed by terminal deoxynucleotidyl transferase-mediated biotinylated UTP nick end labeling, in the cortex. These data provide the first link between Frizzled signaling and axonal development.


Figures

Fig. 1.
Fig. 1.
Targeted replacement of the first coding exon offz3 by lacZ. Top, Partial map of the murine fz3 locus. The first threefz3 coding exons are indicated by filled rectangles. B, BamHI;Bg, BglII; E,EcoRI; H, HindIII;N, NcoI; X,XbaI. Parenthesis indicates elimination of that restriction enzyme site. Bottom, Structure of the fz3 targeting construct and Southern blot hybridization probe. A flanking segment of 8.3 kb located immediately 5′ of the initiator methionine codon of fz3 was joined to the initiator methionine codon of a β-galactosidase expression cassette. The β-galactosidase coding region is followed by an intron and poly(A) site from the mouse protamine-1 gene (lacZ-mp1) (Peschon et al., 1987) and by aphosphoglycerate kinase-neo selectable marker, both with the same orientation. The 5 kb 3′ homology segment encompasses the 5′ 454 bp of the third coding exon and adjacent upstream intron sequences and is followed by a thymidine kinase-negative selectable marker (MC1-TK).Right, Genotyping of fz3(+/+),fz3(+/−), and fz3(−/−) mice byBamHI digestion and Southern blotting with the 5′ flanking BamHI–XbaI probe indicated atleft. The wild-type and gene-targeted alleles generate fragments of 18 and 12 kb, respectively.
Fig. 2.
Fig. 2.
Pattern of fz3 expression as determined by X-gal staining of the knocked-in lacZreporter in fz3(+/−) and fz3(−/−)mice. A, fz3(+/−) embryos at E12 show widespread X-gal staining in the developing CNS. B–D,fz3(−/−) embryos at E18; coronal series from rostral (B) to caudal (D).B, Centered on the striatum; C, centered on the thalamus; D, centered on the tectum. Widespread X-gal staining is seen in the cerebral cortex, diencephalon, and brainstem, with the highest levels in the developing striatum (arrow at 45° angle in B) and the trigeminal ganglia (vertical arrow in B). Staining is also seen in the inner ear (vertical arrowin C), dorsal and ventral thalamic nuclei (45°arrows in C), tectum (arrow in D), and retina (data not shown). fz3(+/−) embryos at E18 show a nearly identical pattern of X-gal staining but at lower intensity. E–H, Adult fz3(+/−) brains show X-gal staining in the cerebral cortex and select midbrain structures with minimal staining in the striatum (arrow in E), cerebellum (arrow in H), and brainstem. Coronal series from rostral (E) to caudal (H). E, Centered on the striatum; F, centered on the thalamus; G, centered on the colliculus; H, centered on the cerebellum.
Fig. 3.
Fig. 3.
Gross anatomic anomalies infz3(−/−) mice. A, B, Newborn fz3(−/−) mice have a curled tail and flexed hindlimbs. C–H, E18 fz3(−/−) mice have enlarged lateral ventricles, a thinned cerebral cortex, and a smaller striatum but essentially normal patterns of NADPH diaphorase (C–F) and acetylcholine esterase (G, H) activity in the CNS.Arrows in C, D,G, and H point to the higher density of stained cells in the lateral striatum. I,J, fz3(+/−) andfz3(−/−) littermates at E18 from a litter in which 2/2fz3(−/−) fetuses have an open cephalic neural tube.
Fig. 4.
Fig. 4.
Morphology of the fz3(−/−)cerebral cortex between E13 and E18. Cresyl violet-stained paraffin sections at E13 (A, B, E,F), E15 (C, D,G, H), and E18 (I,J). The fz3(−/−) cortex has a normal or nearly normal thickness and lamination at E13 (E, F) and E15 (G,H); by E18, the intermediate, subventricular, and ventricular zones are reduced in thickness (I,J). The fz3(−/−) lateral ganglionic eminence (LGE) and medial ganglionic eminence (MGE) are of normal size at E13 (A,B) but are reduced in size by E15 (C,D). CP, Cortical plate;ML, marginal layer; PP, preplate;SP, subplate; IZ, intermediate zone; SV, subventricular zone; VZ, ventricular zone.
Fig. 5.
Fig. 5.
Absence of major fiber tracts in the cortex and striatum in fz3(−/−) brains. Anti-NF200 immunostaining of horizontal sections of the forebrain at E15 (A, D) and at E18 (B,E, dorsal region; C, F, ventral region) and of coronal sections of the forebrain (G, H) and midbrain (I, J) regions. Corticothalamic and thalamocortical fibers passing through the striatum are missing at E15 (arrows in A and D). A complete or nearly complete absence of callosal (leftwardarrows in B andE), corticofugal and thalamocortical (rightward arrows in B and E;arrows in G and H), anterior commissural (arrows in C andF), and cortical (arrows inI and J) fibers is apparent infz3(−/−) embryos at E18. The loss of fibers is most prominent in the rostral cortex and striatum (G,H) and is minimal in the hippocampus (I, J).
Fig. 6.
Fig. 6.
DiI labeling of cortical, commissural, and tectal fiber tracts at E18. A, DiI crystals placed in the caudal region of the striatum of a fz3(+/−) brain label the external capsule and the genu of the corpus callosum in the ipsilateral cortex and the anterior commissure in the contralateral hemisphere (vertical arrows). B, In thefz3(−/−) brain, there is little diffusion of the DiI beyond the site of crystal placement. C, Individualfz3(−/−) cortical neurons labeled with microcrystals of DiI from the cortical surface (top) show normal morphologies. D–L, Serial coronal sections through twofz3(+/−) brains in which DiI crystals were placed in the dorsolateral (D) or lateral (I) cortex. Prominent labeling is seen in cortical fibers traversing the internal capsule (vertical arrows in E–H and horizontal arrows in J–L) and in the genu of the corpus callosum (arrows at 45° angle in J–L).M–P, Serial coronal sections through afz3(−/−) brain in which DiI crystals were placed in the lateral cortex. The DiI has spread locally but has labeled only a small number of fibers traversing the internal capsule (arrow in N). Q–U, Serial sagittal sections through an fz3(−/−) brainstem in which DiI crystals were placed in the lateral tectum.R–U, Efficient labeling of the tectospinal tract (arrows in S–U) with midline crossing in T, a labeling pattern indistinguishable from that seen in fz3(+/+) or fz3(+/−)brains. Sections are 300 μm in thickness.
Fig. 7.
Fig. 7.
Dopaminergic neurons from the substantia nigra fail to innervate the striatum in fz3(−/−) brains. Tyrosine hydroxylase (A, B) and the dopamine transporter (C, D), markers for presynaptic nigrostriatal processes, are absent from thefz3(−/−) striatum at embryonic day 18.E, F, Tyrosine hydroxylase staining of cell bodies in the substantia nigra demonstrates normal numbers of dopaminergic neurons in the fz3(−/−) brain at embryonic day 18.
Fig. 8.
Fig. 8.
DiI tracing from the cortex at E13. Paired bright-field (A–F) and fluorescent (G–L) images of 300-μm-thick serial horizontal sections of an E13 fz3(+/−) head. M–X, The analogous paired series for an E13 fz3(−/−) head. Local spreading of DiI within the cortex and adjacent striatum and labeling of the ipsilateral trigeminal ganglion (arrowsin F, L, R, andX), presumably from DiI in the scalp, are seen in both samples. However, DiI labeling of the thalamus is only seen in thefz3(+/−) brain (arrows inC–E and I–K).
Fig. 9.
Fig. 9.
Ultrastructural defects in thefz3(−/−) striatum and cortex at E18. A,B, A high density of synapses, dendritic processes, and axons is seen in the fz3(+/+) striatum. These structures are mostly missing in the fz3(−/−)striatum, which show numerous spaces between neurons. C,D, The subventricular region of thefz3(+/+) cortex shows a dense packing of fibers and cell bodies. In the corresponding region of the fz3(−/−)cortex, fibers are mostly missing, and numerous spaces separate the remaining cell bodies. Scale bars, 10 μm.
Fig. 10.
Fig. 10.
Normal proliferation and differentiation of cortical neurons in fz3(−/−) brains.A–D, One hour BrdU pulse labeling at E12 (A, B) or E14 (C,D) shows nearly identical numbers of proliferating cells in the ventricular zone of wild-type and fz3(−/−)forebrains. E, F, Calretinin immunoreactivity in the dorsal cortex at E15 reveals Cajal-Retzius cells at the marginal zone (top) together with a subset of neurons in the cortical plate. G, H, Calretinin immunoreactivity in the medial forebrain at E14 reveals a subset of neurons in the most superficial cortical layers (the lateral ventricle is at the top left; the midline is at theright). I, J, TuJ1 immunostaining at E14 shows widespread expression of brain-specific tubulin in postmitotic neurons. K, L, MAP2 immunostaining shows the differentiation and lamination of cortical neurons at E14.
Fig. 11.
Fig. 11.
Cortical migration and striatal cell death infz3(−/−) brains at E18. A–H, BrdU labeling at E13 (A–D) or E14 (E–H); animals were killed at E18. The density of striatal neurons and the density and layering pattern of cortical neurons are similar between fz3(+/−) andfz3(−/−) brains. The fz3(−/−) cortex shows a thinning of the genu of the corpus callosum and the subventricular zone. I–L, TUNEL-labeled cells in 16 μm sections of striatum and cortex at E18. Red dots, The border between the striatum (str) and cortex (ctx). I, J, Typical appearance of fz3(−/−) and fz3(+/−)sections; K, a fz3(−/−) section with an unusually high density of TUNEL-positive cells. L, Mean and SDs of TUNEL-positive cells per 16 μm section of striatum at E18, counted from fz3(+/−) (n = 24 sections) or fz3(−/−) (n = 28 sections) brains.
Fig. 12.
Fig. 12.
Normal numbers and morphologies of dissociated neurons and glia cultured from E18 neocortex or combined E18 striatum and pyriform cortex. Cultures were prepared from pooledfz3(+/−) and fz3(+/+) brains (designated “+/−”) or from pooled fz3(−/−)brains. A–J, Neocortex; K–N, combined striatum and pyriform cortex. Immunostaining was performed after 3–25 d in culture. A, B, K,L, Dendrites visualized by anti-MAP2 immunostaining.C, D, M, N, Glia visualized by anti-GFAP immunostaining. E,F, Axons visualized with anti-neurofilament immunostaining. G–J, Synapses visualized with anti-synaptophysin (G, H) or anti-bassoon (I, J) antibodies.

References

    1. Adler PN, Lee H. Frizzled signaling and cell-cell interactions in planar polarity. Curr Opin Cell Biol. 2001;13:635–640. - PubMed
    1. Auladell C, Perez-Sust P, Super H, Soriano E. The development of thalamocortical and corticothalamic projections in the mouse. Anat Embryol. 2000;201:169–179. - PubMed
    1. Bagri A, Marin O, Plump AS, Mak J, Pleasure SJ, Rubenstein JL, Tessier-Lavigne M. Slit proteins prevent midline crossing and determine the dorsoventral position of major axonal pathways in the mammalian forebrain. Neuron. 2002;33:233–248. - PubMed
    1. Bancroft JD, Stevens A. Theory and practice of histological techniques, pp 396–399. Churchill Livingstone; New York: 1982.
    1. Bayer SA, Altmann J. Neurogenesis and neuronal migration. In: Paxinos G, editor. The rat nervous system. Academic; New York: 1995. pp. 1041–1078.

Publication types

MeSH terms