. 2002 Oct 1;22(19):8574-85.
doi: 10.1523/JNEUROSCI.22-19-08574.2002.

Absence of fibroblast growth factor 2 promotes oligodendroglial repopulation of demyelinated white matter

Affiliations

Absence of fibroblast growth factor 2 promotes oligodendroglial repopulation of demyelinated white matter

Regina C Armstrong et al. J Neurosci. .

Abstract

This study takes advantage of fibroblast growth factor 2 (FGF2) knock-out mice to determine the contribution of FGF2 to the regeneration of oligodendrocytes in the adult CNS. The role of FGF2 during spontaneous remyelination was examined using two complementary mouse models of experimental demyelination. The murine hepatitis virus strain A59 (MHV-A59) model produces focal areas of spinal cord demyelination with inflammation. The cuprizone neurotoxicant model causes extensive corpus callosum demyelination without a lymphocytic cell response. In both models, FGF2 expression is upregulated in areas of demyelination in wild-type mice. Surprisingly, in both models, oligodendrocyte repopulation of demyelinated white matter was significantly increased in FGF2 -/- mice compared with wild-type mice and even surpassed the oligodendrocyte density of nonlesioned mice. This dramatic result indicated that the absence of FGF2 promoted oligodendrocyte regeneration, possibly by enhancing oligodendrocyte progenitor proliferation and/or differentiation. FGF2 -/- and +/+ mice had similar oligodendrocyte progenitor densities in normal adult CNS, as well as similar progenitor proliferation and accumulation during demyelination. To directly analyze progenitor differentiation, glial cultures from spinal cords of wild-type mice undergoing remyelination after MHV-A59 demyelination were treated for 3 d with either exogenous FGF2 or an FGF2 neutralizing antibody. Elevating FGF2 favored progenitor proliferation, whereas attenuating endogenous FGF2 activity promoted the differentiation of progenitors into oligodendrocytes. These in vitro results are consistent with enhanced progenitor differentiation in FGF2 -/- mice. These studies demonstrate that the FGF2 genotype regulates oligodendrocyte regeneration and that FGF2 appears to inhibit oligodendrocyte lineage differentiation during remyelination.


Figures
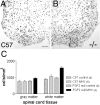
Fig. 1.
Fig. 1.
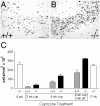
Oligodendrocyte repopulation after MHV-A59 demyelination. C57BL/6 mice (C57) were used as the calibrator strain in which the MHV-A59 model is well characterized. FGF2 null (−/−) mice were compared with and without MHV-A59 infection, relative to the C57BL/6 strain. All MHV-A59 infected mice had a clinical score of at least 2, indicating limb paralysis and/or paresis associated with spinal cord demyelination. All mice were killed 8 weeks after MHV-A59 infection, when remyelination is well underway. Control mice were age-matched noninjected mice. In situ hybridization for PLP mRNA was used to identify oligodendrocytes, as shown in representative ventrolateral quadrants of spinal cord sections for a MHV-A59 infected C57BL/6 mouse (A) and a MHV-A59 infected FGF2 null mouse (B). For comparison, the images are aligned at the midline (A, central canal,top right; B, central canal, top left). Oligodendrocytes were counted in entire transverse 15 μm sections of lumbar spinal cord (C). The number of oligodendrocytes was similar in control mice of both genotypes. However, FGF2 null mice recovering from MHV-A59 had a significantly (p < 0.0031) higher density of white matter oligodendrocytes compared with C57BL/6 mice after MHV-A59. Number of mice sampled for each genotype and condition is shown in parentheses in the symbol legend. Values shown are mean ± SD. Scale bar, 100 μm.
Fig. 2.
Fig. 2.
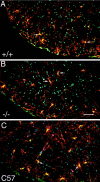
Oligodendrocyte progenitors in normal adult spinal cord. Oligodendrocyte progenitors were identified in transverse sections of lumbar spinal cord using immunostaining for NG2 (red) and PDGFαR (green) in combination with a DAPI nuclear stain (blue). Colocalization of immunoreactivity for NG2 and for PDGFαR appearsyellow because of the integration of redand green signal in those pixels. FGF2+/+ mice (A), FGF2 −/− mice (B), and C57BL/6 (C57; C) wild-type mice had grossly similar populations of oligodendrocyte progenitors (examples at arrows) with highly variable branched processes, as shown in representative areas of transverse sections of ventral spinal cord. Scale bar, 50 μm.
Fig. 3.
Fig. 3.
Myelin and oligodendrocyte loss in cuprizone demyelination of FGF2 −/− mice. Mice were fed normal chow continuously (A, B) or 0.3% cuprizone for either 3 weeks (C, D) or 6 weeks (E, F). Coronal brain sections were then examined by Luxol fast blue with periodic-acid Schiff reaction to stain myelin blue (A, C, E) and by immunostaining with CC1 antibody to identify oligodendrocyte cell bodies (green; B, D, F). The corpus callosum between the midline and cingulum bilaterally demyelinates, progressing between 3 and 6 weeks of cuprizone ingestion (A, C, E). Oligodendrocytes were abundant and distributed in characteristic rows in the normal corpus callosum (B). However, the frequency of oligodendrocytes was dramatically decreased in number in the corpus callosum after 3 weeks of cuprizone (D) yet began to increase after 6 weeks on cuprizone (F). Scale bars: A, C, E, 500 μm; B, D, F, 25 μm.
Fig. 4.
Fig. 4.
Increased FGF2 mRNA expression in cuprizone demyelinated corpus callosum. In situhybridization was used to detect FGF2 mRNA expression in coronal sections of C57BL/6 mice. The nontreated mice (A) had few FGF2 mRNA labeled cells in the corpus callosum relative to the abundant FGF2 mRNA expression in various adjacent neuronal populations. In contrast, mice treated with cuprizone for 6 weeks (B) had strong FGF2 mRNA expression in many cells within the lesion area of the corpus callosum (above lateral ventricle,LV). For comparison, the images are aligned at the midline (A, right side; B, left side). Scale bar, 250 μm.
Fig. 5.
Fig. 5.
Oligodendrocyte population changes during cuprizone demyelination and remyelination. In situhybridization for PLP mRNA was used to identify oligodendrocytes, as shown in representative images of the corpus callosum fromFGF2 +/+ mice (A) andFGF2 −/− mice (B). In bothA and B, mice were treated with cuprizone for 6 weeks and then taken off cuprizone for a 3 week recovery period. For comparison, both images show the corpus callosum from the midline laterally to under the cingulum and are aligned at the midline (A, right side; B, left side). The PLP mRNA expression appears markedly increased in the FGF2−/− (B) compared with the FGF2+/+ section (A). Unbiased stereological techniques were used to determine the density of oligodendrocytes, identified by PLP mRNA expression, in the corpus callosum from the midline laterally to under the cingulum (C).White bars denote nontreated FGF2 −/− mice that are age-matched to the start of cuprizone (8 weeks) and the end of the recovery after cuprizone (17 weeks). For cuprizone-treated mice, the gray bars denote FGF2 +/+ mice, and black bars denote FGF2 −/− mice. Dramatic oligodendrocyte loss was evident after 3 weeks of cuprizone (3 wk cup). Cuprizone treatment for 6 weeks (6 wk cup) coincided with the initial regeneration of the oligodendrocyte population. After 6 weeks on cuprizone followed by 3 weeks of normal chow (6 wk cup, 3 wk off), the oligodendrocyte density showed extensive repopulation of the corpus callosum in cuprizone-treated mice. Compared with theFGF2 +/+ mice, the FGF2 −/− mice had dramatically enhanced recovery of oligodendrocytes (p = 0.0053; 6 wk cup, 3 wk off). The number of mice sampled for each value is as follows: nontreated FGF2 −/− at 8 weeks,n = 3; 3 week cup, n = 4 for both genotypes; 6 week cup, n = 3FGF2 +/+, n = 4 FGF2−/−; 6 week cup with 3 weeks off, n = 3 for both genotypes; nontreated FGF2 −/− at 17 weeks,n = 6. Values shown are mean ± SD. Scale bar, 100 μm.
Fig. 6.
Fig. 6.
Oligodendrocyte progenitor proliferation and accumulation during cuprizone demyelination. Oligodendrocyte progenitors undergoing active proliferation were identified by two methods. As shown in the example in A, oligodendrocyte progenitors were immunostained for NG2 (red) and PDGFαR (green), and active cell division was evident as mitotic figures with DAPI stain (blue). Colocalization of immunoreactivity for NG2 and for PDGFαR appearsyellow because of the integration of redand green signal in those pixels. Oligodendrocyte progenitors were also identified by in situhybridization for PDGFαR, and proliferation was estimated based on incorporation of BrdU during a 4 hr pulse before killing (B, C). At high magnification, BrdU incorporation was detected as brown nuclear signal, and PDGFαR mRNA was detected as blue–black cytoplasmic signal (C; border area between lesion, left, and non-lesioned corpus callosum to the right). The frequency of progenitors, many with BrdU labeling, was visibly different in demyelinated areas of the corpus callosum (lesion, area under double arrowhead) relative to adjacent normal appearing white matter (NAWM, area under double arrowhead). Cells labeled (+) for PDGFαR mRNA and/or BrdU were counted in the corpus callosum lesions and NAWM ofFGF2 +/+ and −/− mice killed after 5 weeks on cuprizone (D). Oligodendrocyte progenitors clearly accumulated in the lesion areas compared with NAWM (PDGFαR+, BrdU−), and proliferating progenitors were more frequent in lesion areas (PDGFαR+, BrdU+). Cells other than progenitors, not identified by cell type-specific markers, also exhibited more proliferation in lesions (PDGFαR−, BrdU+). There were no significant differences between the FGF2 +/+ mice and FGF2 −/− mice for any of these cell populations (n = 6 mice of each genotype). Values shown are mean ± SD. Scale bars:A, 10 μm; B, 500 μm;C, 50 μm.
Fig. 7.
Fig. 7.
Retroviral cell lineage analysis of oligodendrocyte progenitor differentiation. Mixed glial cultures were prepared from spinal cords of MHV-A59 infected C57BL/6 mice at the onset of remyelination (4 weeks after infection). The cultured cells were infected with BAG replication-incompetent retrovirus so that β-gal expression served as a heritable marker of oligodendrocyte lineage cells that were clonally derived from a progenitor cell. Cultures were triple immunostained to simultaneously detect β-gal (A–C; green), the oligodendrocyte progenitor marker NG2 (D–F; blue), and O1 as a marker of differentiated oligodendrocytes (G–I; red). Thepanels show examples of three separate clones illustrating each of the phenotypes identified within the oligodendrocyte lineage. Oligodendrocyte progenitors (pair of cells at arrows inA, D, G; grown in defined medium) were retrovirally infected based on β-gal immunostaining and expressed NG2 but not O1 antigens. Differentiated oligodendrocytes (pair of cells at arrows in C, F, G; grown in defined medium with FGF2 neutralizing antibody) were retrovirally infected based on β-gal immunostaining and expressed O1 antigens but not NG2. A transitional stage of differentiation was also observed (arrow in B, E, H; grown in defined medium with FGF2 neutralizing antibody) which expressed NG2 while also being recognized by O1. Scale bars:A, D, G, 25 μm; B, C, E, F, H,I, 50 μm.
Fig. 8.
Fig. 8.
Myelin immunostaining during remyelination. In coronal brain sections from mice that had been treated with cuprizone for 6 weeks followed by 3 weeks off cuprizone, myelin in the corpus callosum was detected with immunostaining for MOG (brown DAB reaction product). Variable amounts of MOG-immunostained myelin were present in the corpus callosum ofFGF2 +/+ mice (A, C) and FGF2 −/− mice (B, D) as remyelination progressed during the 3 weeks after cuprizone treatment was discontinued. In each panel, of three mice examined for each genotype, the one with the most extensive MOG immunostaining is shown for that genotype.C and D are higher- magnification images from the corpus callosum under the cingulum within A andB, respectively. At this higher magnification, theFGF2 +/+ mice (C) appear to have fewer myelin sheaths so that the immunostaining is discontinuous along axons in contrast to the FGF2 −/− mice (D) in which a similar area appears more extensively myelinated. Scale bars: A, B, 500 μm;C, D, 50 μm.

References

    1. Allamargot C, Pouplard-Barthelaix A, Fressinaud C. A single intracerebral microinjection of platelet-derived growth factor (PDGF) accelerates the rate of remyelination in vivo. Brain Res. 2001;918:28–39. - PubMed
    1. Armstrong R, Friedrich VL, Holmes K V, Jr, Dubois-Dalcq M. In vitro analysis of the oligodendrocyte lineage in mice during demyelination and remyelination. J Cell Biol. 1990;111:1183–1195. - PMC - PubMed
    1. Arnett HA, Mason J, Marino M, Suzuki K, Matsushima GK, Ting JP. TNF alpha promotes proliferation of oligodendrocyte progenitors and remyelination. Nat Neurosci. 2001;4:1116–1122. - PubMed
    1. Bansal R, Pfeiffer SE. Novel stage in the oligodendrocyte lineage defined by reactivity of progenitors with R-mAb prior to O1 anti-galactocerebroside. J Neurosci Res. 1992;32:309–316. - PubMed
    1. Bansal R, Pfeiffer SE. Regulation of oligodendrocyte differentiation by fibroblast growth factors. Adv Exp Med Biol. 1997;429:69–77. - PubMed

Publication types

MeSH terms

LinkOut - more resources