. 2002 Oct 1;22(19):8619-32.
doi: 10.1523/JNEUROSCI.22-19-08619.2002.

Responses of neurons in cat primary auditory cortex to bird chirps: effects of temporal and spectral context

Affiliations

Responses of neurons in cat primary auditory cortex to bird chirps: effects of temporal and spectral context

Omer Bar-Yosef et al. J Neurosci. .

Abstract

The responses of neurons to natural sounds and simplified natural sounds were recorded in the primary auditory cortex (AI) of halothane-anesthetized cats. Bird chirps were used as the base natural stimuli. They were first presented within the original acoustic context (at least 250 msec of sounds before and after each chirp). The first simplification step consisted of extracting a short segment containing just the chirp from the longer segment. For the second step, the chirp was cleaned of its accompanying background noise. Finally, each chirp was replaced by an artificial version that had approximately the same frequency trajectory but with constant amplitude. Neurons had a wide range of different response patterns to these stimuli, and many neurons had late response components in addition, or instead of, their onset responses. In general, every simplification step had a substantial influence on the responses. Neither the extracted chirp nor the clean chirp evoked a similar response to the chirp presented within its acoustic context. The extracted chirp evoked different responses than its clean version. The artificial chirps evoked stronger responses with a shorter latency than the corresponding clean chirp because of envelope differences. These results illustrate the sensitivity of neurons in AI to small perturbations of their acoustic input. In particular, they pose a challenge to models based on linear summation of energy within a spectrotemporal receptive field.


Figures

Fig. 1.
Fig. 1.
Histograms of parameters extracted from natural chirps. A, Chirp extent. B, Chirp rate.Positive values correspond to upward chirps, andnegative values correspond to downward chirps.
Fig. 2.
Fig. 2.
Stimuli used in the experiments. Each stimulus is displayed as a waveform (top panel of eachpair) and as a spectrogram (bottom panelof each pair). The waveform is in analog-to-digital (A/D) units and has the same scale in all panels. Similarly, the values of the spectral energy are in decibels with respect to 1 A/D unit, and the color range is the same in all panels. The frequency axis is always 0–10 kHz. Two bottom rows, Long stimuli.Long (Full), Entire time course of the Long stimuli, with the selected chirps marked by the red lines, except that Stimulus-4 is part of Stimulus-3 and is not marked separately. Long (Extract), Magnified segment of the Long stimulus around the time of the chirp. Thetop three rows show three versions of the short stimuli: the Natural version, which is identical to the chirp that appears in Long; the Main version, which is the tonal component cleaned from the noise, including its frequency and amplitude modulation; and the Artificial version, which has a simplified frequency trajectory as Main and a constant temporal envelope.
Fig. 3.
Fig. 3.
Comparison between the Natural and Main versions of all the stimuli. A, Waveforms of Natural (black, in the background) and Main (gray, in the foreground). Note the similarity in the temporal envelopes. B, Magnified view of the first 5 msec of each stimulus (Natural in black, Main ingray). The tonal component, Main, starts right at the beginning of Natural; there is no delay between the onset of the background noise and the onset of the tonal component.
Fig. 4.
Fig. 4.
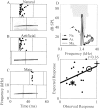
Generation of FRA predictions.A–C, Responses to the three short versions (Natural, Main, Artificial) of one stimulus. The estimated response onset is marked on the raster plot. Below the raster plots, the spectrogramsof the three sounds are presented. The section of the sound that starts 15 msec before response onset lasts 30 msec and is assumed to have produced the response. D, FRA of this neuron, with each frequency level tile set to 1 if it is inside the tuning curve and to 0 otherwise. The power spectra of the three sections fromA–C are superimposed. These power spectra were resampled at the frequencies at which the FRA was measured. The FRA prediction is the number of frequency level combinations that were traversed by the power spectra. E, Scatter plot of the FRA predictions versus the actual responses of the entire set of stimuli. Only a weak correlation is found for this neuron. The reportedr is the square root of the increase in explained variance and is not significantly different from 0.
Fig. 5.
Fig. 5.
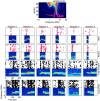
Responses of five neurons to the Long, Natural, and Main versions of stimulus 5. The FRAs of the neurons are displayed in the top row (BFs: A, 2.4;B, 5.4; C, 3.4; D, 5.4;E, 6.1 kHz). The color scale represents the firing rate, in which blue is 0 andred is the maximal rate of each neuron (A, 47; B, 86; C, 63;D, 109; E, 136 spikes/sec). The spectra of Main (magenta) and Natural (red) at the actual level in which they were presented is plotted at thetop of the FRA. The responses are displayed as araster plot above the spectrogram of the corresponding stimulus, plotted as in Figure 2. The two bottom rows display the responses to the Long stimuli. Long (Full), Responses to the entire duration of Long. Thered lines mark the borders of Natural. Long (Extract), Magnified view of the segment in Long that contains the Natural stimulus. The responses to Natural and Main are displayed in the correspondingly marked rows. The time axes in therows marked Long (Extract),Natural, and Main are all aligned.
Fig. 6.
Fig. 6.
Responses of a single neuron to the Long, Natural, and Main versions of all six stimuli, in the same format as Figure 5. The BF is 4.7 kHz. The maximal firing rate is 260 spikes/sec.
Fig. 7.
Fig. 7.
Scatter plots of the normalized spike count of Main and Natural versus Long. Each point represents the responses of one neuron to one stimulus, and there are a total ofn = 271 neuron × stimulus combinations. Anx = y equality lineis plotted in gray. The responses displayed in Figure 5are marked with the following symbols: A,circles; B, asterisks;C, squares; D,diamonds; E, triangles. Error bars indicate 1 SE.
Fig. 8.
Fig. 8.
Responses of five neurons to the Natural, Main, and Artificial versions of stimulus 1. The top rowpresents the FRA of five neurons (BFs: A, 2.6;B, 2.7; C, 2.8; D, 5.3;E, 1.7 kHz). The color scale represents the firing rate, in which blue is 0 andred is the maximal rate of each neuron (A, 116; B, 128; C, 65;D, 180; E, 166 spikes/sec). The spectra of Natural (red), Main (magenta), and Artificial (black) at the actual level in which they were presented are plotted at the top of the FRA. The responses are displayed as raster plots above thespectrogram of the corresponding stimulus. The time axes in all rows are aligned.
Fig. 9.
Fig. 9.
Responses of a single neuron to the Natural, Main, and Artificial versions of all six stimuli, in the same format as Figure 4. The BF is 4.8 kHz. The maximal firing rate is 245 spikes/sec.
Fig. 10.
Fig. 10.
Scatter plots of the normalized spike count of the responses to the Natural, Main, and Artificial versions of all stimuli. Individual points are plotted for each neuron × stimulus condition. An x =y equality line is plotted ingray. The responses displayed in Figure 7 are marked with the following symbols: A, circles;B, asterisks; C,squares; D, diamonds;E, triangles. Error bars indicate 1 SE. The numbers of points are 232 in A andB and 319 in C.
Fig. 11.
Fig. 11.
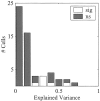
Histogram of the adjusted fraction of variance in the responses that is explained by the FRA predictions. Gray bars correspond to values that are not statistically significant at the p = 0.05 level; white bars correspond to values that are significant.
Fig. 12.
Fig. 12.
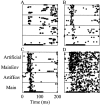
Responses of four neurons to Main, Artificial, MainEnv, and ArtifEnv. The BFs of the neurons are as follows:A, 2.8; B, 5.8; C, 6.3;D, 7 kHz. The responses are displayed as raster plots. The period of stimulus presentation is denoted by athick line at the bottom of the response to Main.
Fig. 13.
Fig. 13.
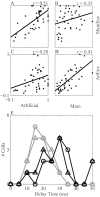
Onset latency and response to Main, Artificial, MainEnv, and ArtEnv. A–D, Scatter plots of the responses to Main, Artificial, MainEnv, and ArtEnv. The results represent responses of 14 neurons to 3 stimuli (1, 3, 5), with an individual count for each neuron × stimulus condition.E, Distributions of the onset latency of Main (black circles), Artificial (gray triangles), ArtEnv (black triangles, similar to Main), and MainEnv (gray circles, similar to Artificial).

References

    1. Brosch M, Schreiner CE. Time course of forward masking tuning curves in cat primary auditory cortex. J Neurophysiol. 1997;77:923–943. - PubMed
    1. Brugge JF, Reale RA, Hind JE. Spatial receptive fields of primary auditory cortical neurons in quiet and in the presence of continuous background noise. J Neurophysiol. 1998;80:2417–2432. - PubMed
    1. Calford MB, Semple MN. Monaural inhibition in cat auditory cortex. J Neurophysiol. 1995;73:1876–1891. - PubMed
    1. Calhoun BM, Schreiner CE. Spectral envelope coding in cat primary auditory cortex: linear and non-linear effects of stimulus characteristics. Eur J Neurosci. 1998;10:926–940. - PubMed
    1. deCharms RC, Blake DT, Merzenich MM. Optimizing sound features for cortical neurons. Science. 1998;280:1439–1443. - PubMed

Publication types

LinkOut - more resources