. 2002 Oct 1;22(19):8691-704.
doi: 10.1523/JNEUROSCI.22-19-08691.2002.

Model of thalamocortical slow-wave sleep oscillations and transitions to activated States

Affiliations

Model of thalamocortical slow-wave sleep oscillations and transitions to activated States

Maxim Bazhenov et al. J Neurosci. .

Abstract

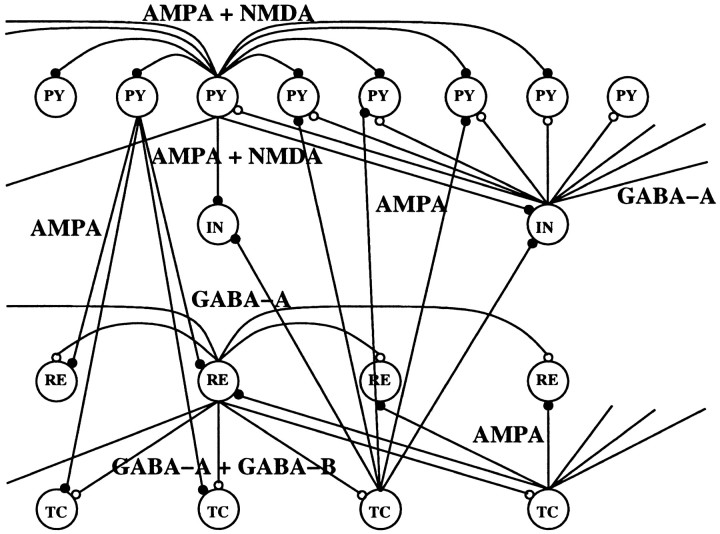
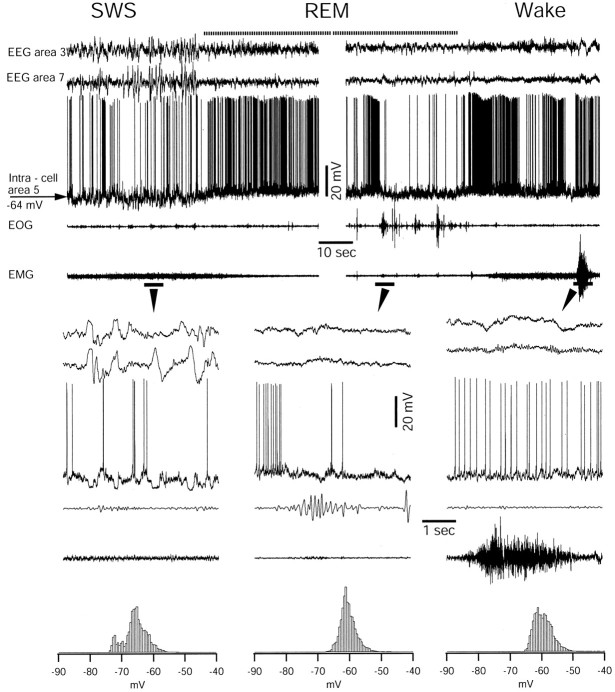
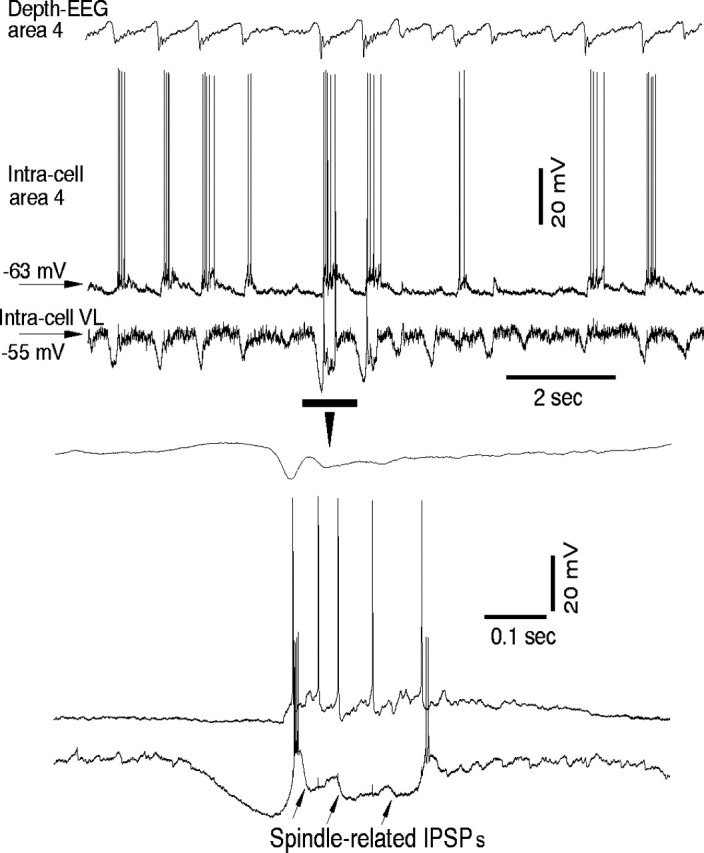
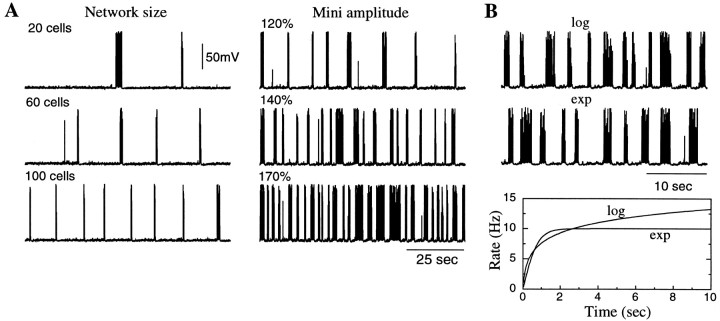
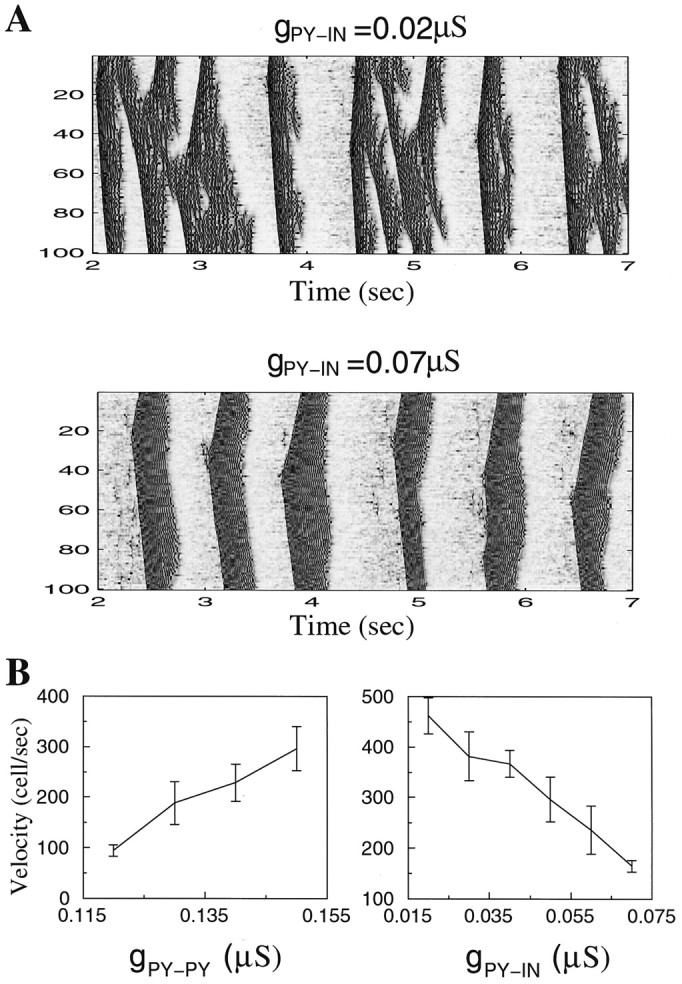
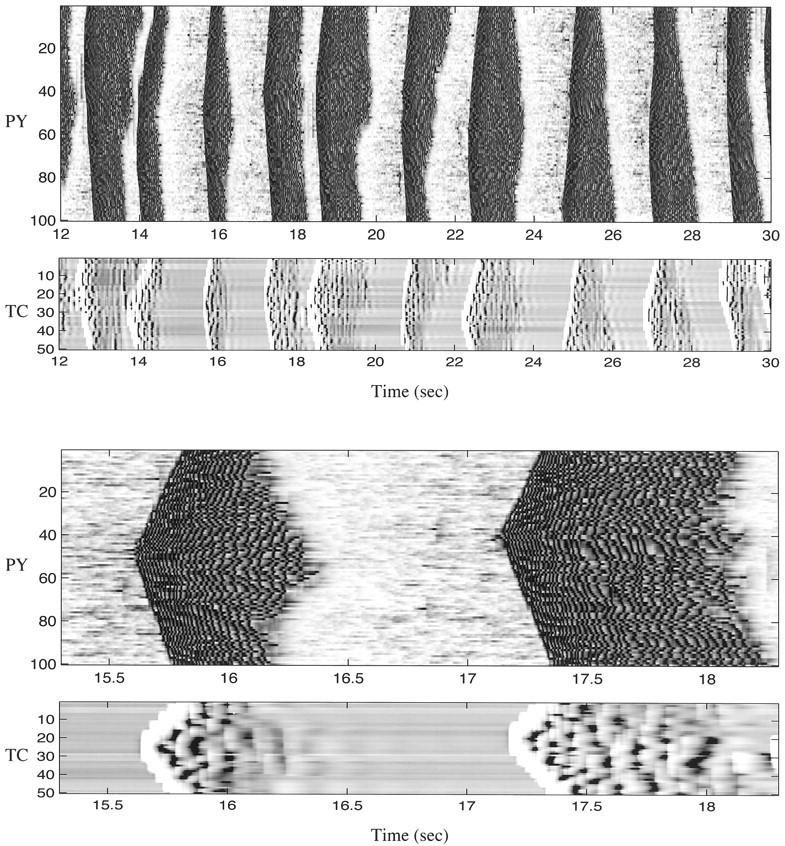
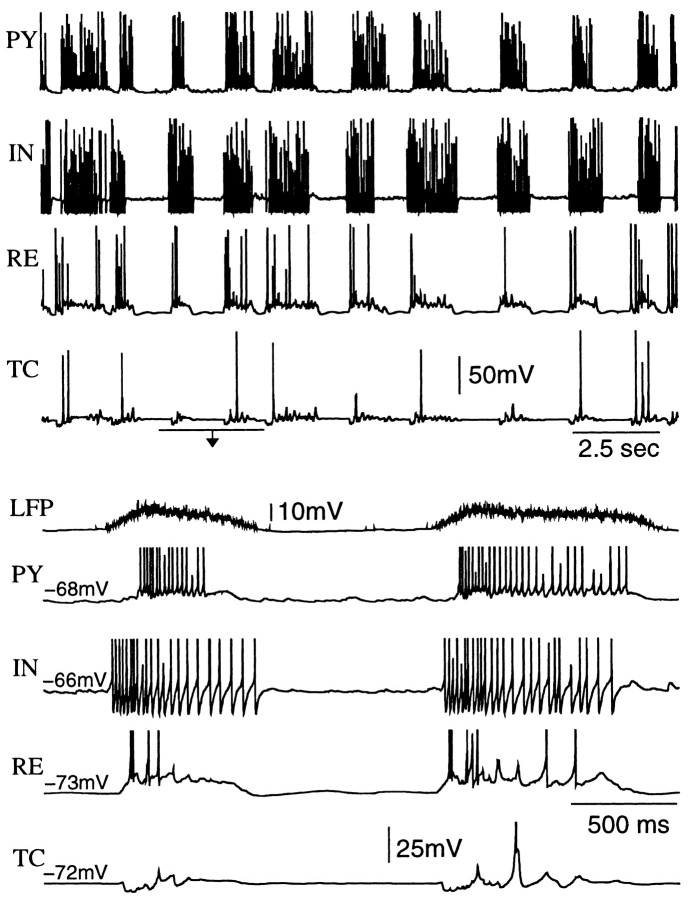
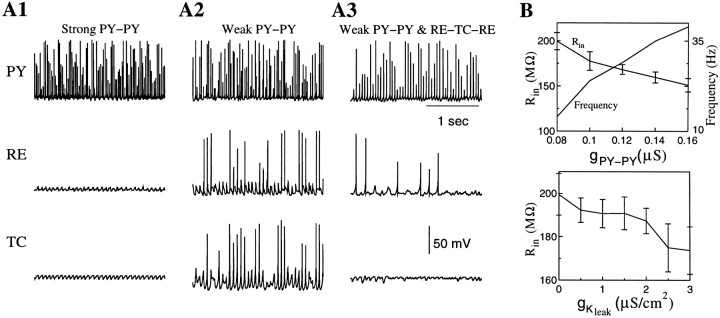
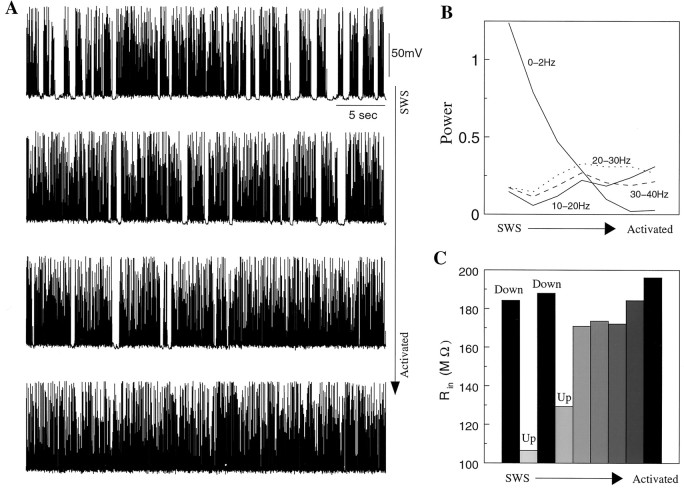
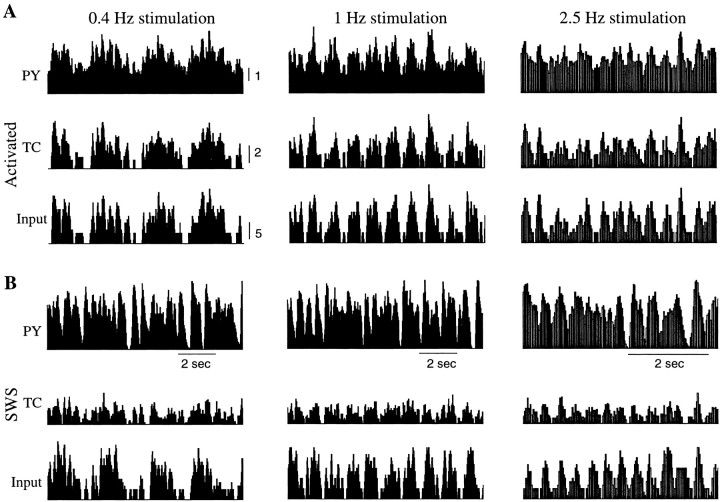
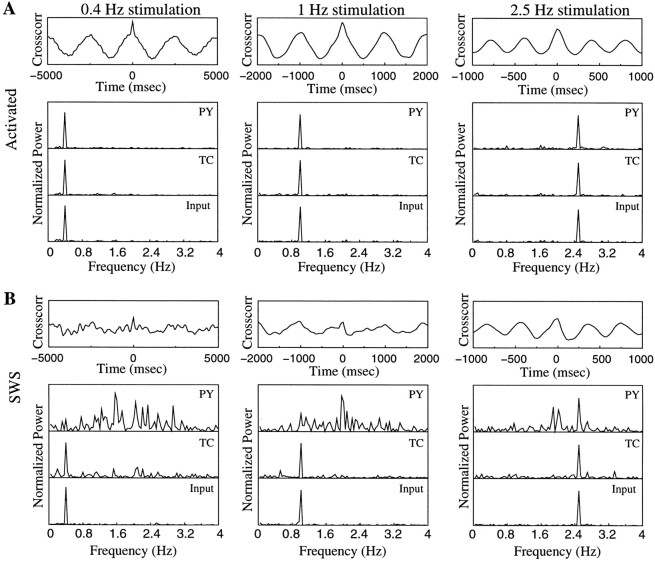
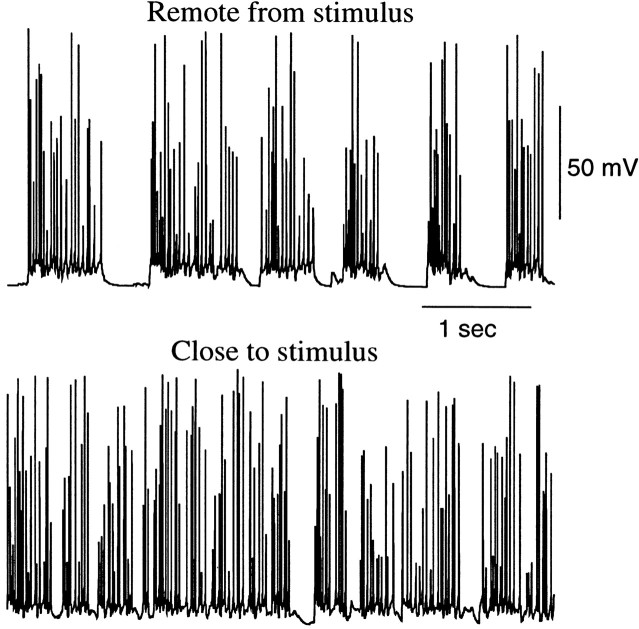
During natural slow-wave sleep (SWS) in nonanesthetized cats, silent (down) states alternate with active (up) states; the down states are absent during rapid-eye-movement sleep and waking. Oscillations (<1 Hz) in SWS and transformation to an activated awake state were investigated with intracellular recordings in vivo and with computational models of the corticothalamic system. Occasional summation of the miniature EPSPs during the hyperpolarized (silent) phase of SWS oscillation activated the persistent sodium current and depolarized the membrane of cortical pyramidal (PY) cells sufficiently for spike generation. In the model, this triggered the active phase, which was maintained by lateral PY-PY excitation and persistent sodium current. Progressive depression of the excitatory interconnections and activation of Ca2+-dependent K+ current led to termination of the 20-25 Hz activity after 500-1000 msec. Including thalamocortical (TC) and thalamic reticular neurons in the model increased the duration of the active epochs up to 1-1.5 sec and introduced waning spindle sequences. An increase in acetylcholine activity, which is associated with activated states, was modeled by the reduction in the K+ leak current in PY and TC cells and by a decrease in intracortical PY-PY synaptic conductances. These changes eliminated the hyperpolarizing phases of network activity and transformed cortical neurons to tonic firing at 15-20 Hz. During the transition from SWS to the activated state, the input resistance of cortical neurons gradually increased and, in a fully activated state, reached the same or even higher values as during silent phases of SWS oscillations. The model describes many essential features of SWS and activated states in the thalamocortical system as well as the transition between them.


Figures

Fig. 1.
Fig. 1.
Network geometry. Network model included four layers of neurons with N PY, M IN, L RE, and L TC cells. In most simulations we used N = 100, M = 25, and L = 50.
Fig. 2.
Fig. 2.
Intracellular activity of neocortical neuron during three major states of vigilance in a chronically implanted, nonanesthetized cat. High-amplitude and low-frequency field potentials, intracellular cyclic hyperpolarizing potentials, and stable muscle tone are distinctive features of SWS. Low-amplitude and high-frequency field potential oscillations, tonic neuronal firing with small fluctuations in the membrane potential, rapid eye movements, and muscle atonia are cardinal features of REM sleep. There is a slight hyperpolarization during REM-related ocular saccades. Low-amplitude and high-frequency field potential oscillations, tonic firing with smaller fluctuations in the membrane potential, and muscle tone with periodic contractions are characteristics of the waking state. The parts indicated byarrows are expanded below. At bottom are histograms of membrane potential distribution during three states of vigilance. Histograms were constructed by sampling of neuronal activity at 10 kHz and counting the number of samples with bins of 0.5 mV.
Fig. 3.
Fig. 3.
Sleep spindles in cortical and thalamocortical neurons during the slow oscillation under ketamine–xylazine anesthesia. Three traces show depth-EEG from area 4, intracellular activity from an area 4 cortical neuron, and intracellular activity of a thalamocortical neuron from the ventrolateral nucleus of the thalamus. The part indicated by the horizontal bar is expanded at the bottom. Note that the thalamocortical neuron does not fire during all cycles of the slow oscillation, and the cortical neuron does not follow all spike bursts of the thalamocortical neuron.
Fig. 4.
Fig. 4.
Patterns of spontaneous activity in the model network of PY and IN cells. A, On theleft, network size increase from 20 PY–5 IN cells to 100 PY–25 IN cells led to higher frequency of spontaneous bursting and increased its regularity. On the right, an increase of the miniature EPSP amplitudes in the network of 20 PY–5 IN cells up to 170% of that on the left had a similar effect as an increase of network size. B, The shape of the function describing the mini average rate increase (logarithmic vs exponential) had little effect on the network dynamics.
Fig. 5.
Fig. 5.
Effect of PY–PY and PY–IN conductances on spontaneous waves propagation. A, Reduction of the maximal conductances for PY–IN synapses decreased the regularity of spontaneous patterns. B, Velocity of propagation (in cells per second) versus maximal conductances for PY–PY and PY–IN synapses.
Fig. 6.
Fig. 6.
Two-dimensional plots of spontaneous activity in the thalamocortical network. One hundred PY–25 IN–50 RE–50 TC cells were simulated. Two active periods are expanded below. It shows that each pattern of activity was randomly initiated at different foci of the network.
Fig. 7.
Fig. 7.
Membrane potential traces of individual PY, IN, RE, and TC cells from the network in Figure6. Spontaneous firing in the PY–IN network initiated waning spindles in the RE–TC network. The spindles in TC cells usually started with two to three cycles of subthreshold (no spikes) oscillations mediated by inhibitory input from RE neurons.
Fig. 8.
Fig. 8.
Effects of synaptic conductances and potassium leak current on network activity. Decrease of potassium leak current inPY and TC cells transformed SWS oscillations into persistent firing at frequency depending on PY–PY synaptic conductance. A, In the presence of the strongRE–TC–RE coupling the RE–TC network generated spontaneous spindles even during continuous firing in the PY–IN network.A1,gPYPY = 0.15 μS, gRETC = 0.2 μS,gTCRE = 0.4 μS. A2,gPYPY = 0.09 μS, gRETC = 0.2 μS,gTCRE = 0.4 μS. A3,gPYPY = 0.09 μS, gRETC = 0.1 μS,gTCRE = 0.2 μS. B, Input resistance of PY cells and frequency of spontaneous firing versus maximal conductances for AMPA-mediated PY–PY synapses (gKL = 0,gRETC = 0.1 μS, gTCRE = 0.2 μS) and potassium leak channels (gPYPY= 0.08 μS,gRETC = 0.1 μS, andgTCRE = 0.2 μS).
Fig. 9.
Fig. 9.
Transition from SWS oscillation to activated state in the thalamocortical network model. A, Decrease of the maximal conductances for potassium leak current in PY and TC cells and synaptic conductance between PY neurons eliminated silent phases in the cortical network activity. The firing became persistent and its frequency stabilized at ∼17 Hz. SWS state:gPYPY = 0.15 μS, gRETC = 0.2 μS,gTCRE = 0.4 μS, gKL = 0.3 μS/cm2; activated state:gPYPY = 0.08 μS, gRETC = 0.1 μS,gTCRE = 0.2 μS, gKL = 0. B, Integrated power in different frequency bands (as indicated in this figure) during transition to activated state. C, The input resistance of PY cells increased from ∼110 MΩ (during up phases of SWS oscillations) to ∼190 MΩ (during activated state), thus reaching the level of the input resistance during silent (Down) phases of SWS.
Fig. 10.
Fig. 10.
Cortical response during thalamic stimulation. Twenty-five percent of the TC cells were stimulated by Poisson-distributed spike trains; those rates were modulated at 0.4, 1, and 2.5 Hz. A, Activated state. B, SWS state. For each graph, the bottom panelshows an RSH of the input spike trains; the middle panelshows an RSH averaged over all TC cells receiving input (25% of TC population); the top panel shows an RSH averaged over PY cells receiving afferents from those TC neurons that were stimulated (25% of the total PY population). The ability of the thalamocortical network to transmit sensory input was reduced in the SWS state.
Fig. 11.
Fig. 11.
Precision of PY responses during thalamic stimulation. Power spectra of RSHs from Figure 10 and cross-correlations between input RSHs and PY responses are shown.A, Activated state. B, SWS state. During SWS oscillations the low-frequency input was masked by intrinsic network oscillations more severely than input at higher frequencies.
Fig. 12.
Fig. 12.
Cortical activity at different distances from the stimulation site. Two PY neurons from the PY–IN–RE–TC network are shown. The cell receiving excitatory drive from the thalamus shows almost persistent firing (bottom panel), while a remotely located cell displays “normal” SWS activity (top panel).

References

    1. Abbott LF, Varela JA, Sen K, Nelson SB. Synaptic depression and cortical gain control. Science. 1997;275:220–224. - PubMed
    1. Achermann P, Borbely AA. Low-frequency (<1 Hz) oscillations in the human sleep electroencephalogram. Neuroscience. 1997;81:213–222. - PubMed
    1. Alzheimer C, Schwindt PC, Crill WE. Modal gating of Na+ channels as a mechanism of persistent Na+ current in pyramidal neurons from rat and cat sensorimotor cortex. J Neurosci. 1993;13:660–673. - PMC - PubMed
    1. Amzica F, Steriade M. Disconnection of intracortical synaptic linkages disrupts synchronization of a slow oscillation. J Neurosci. 1995a;15:4658–4677. - PMC - PubMed
    1. Amzica F, Steriade M. Short- and long-range neuronal synchronization of the slow (<1 Hz) cortical oscillation. J Neurophysiol. 1995b;73:20–38. - PubMed

Publication types

MeSH terms

LinkOut - more resources