Review
. 2002 Oct;16(4):451-63.
doi: 10.1002/jmri.10172.

Combined magnetic resonance imaging and spectroscopic imaging approach to molecular imaging of prostate cancer

Affiliations
Review

Combined magnetic resonance imaging and spectroscopic imaging approach to molecular imaging of prostate cancer

John Kurhanewicz et al. J Magn Reson Imaging. 2002 Oct.

Abstract

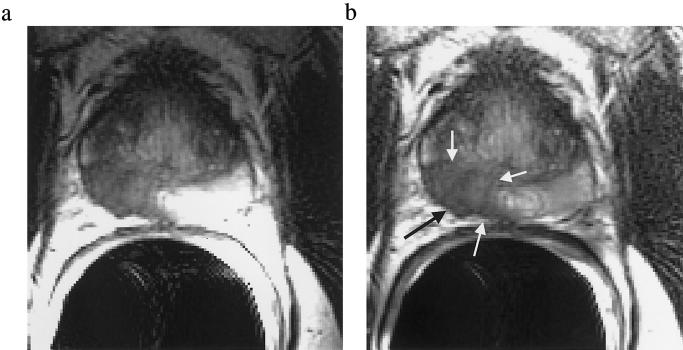
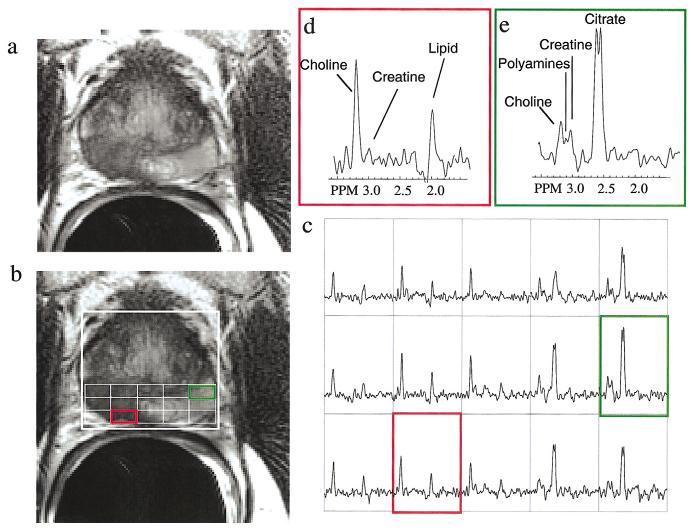
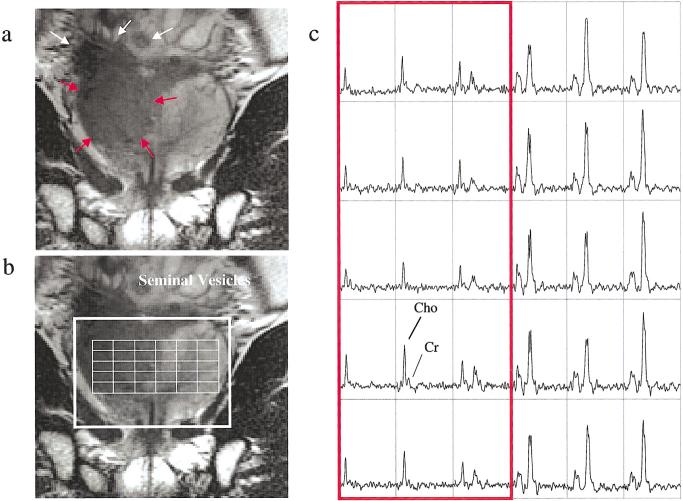
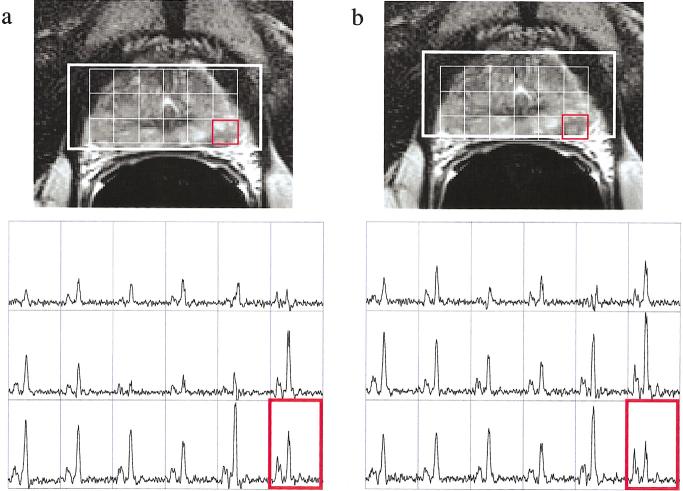
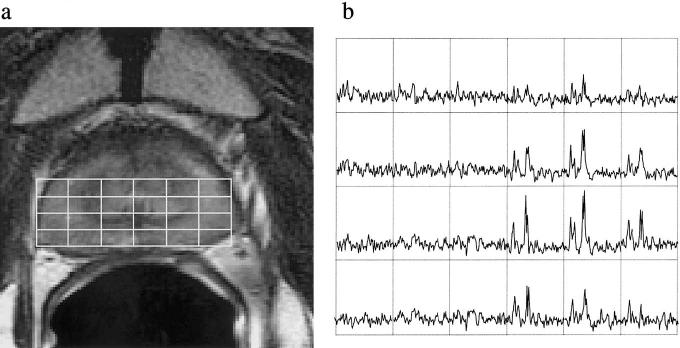
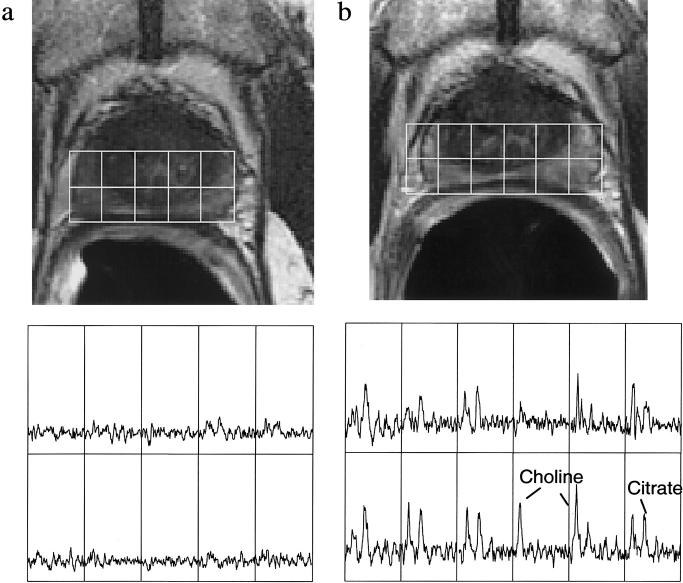
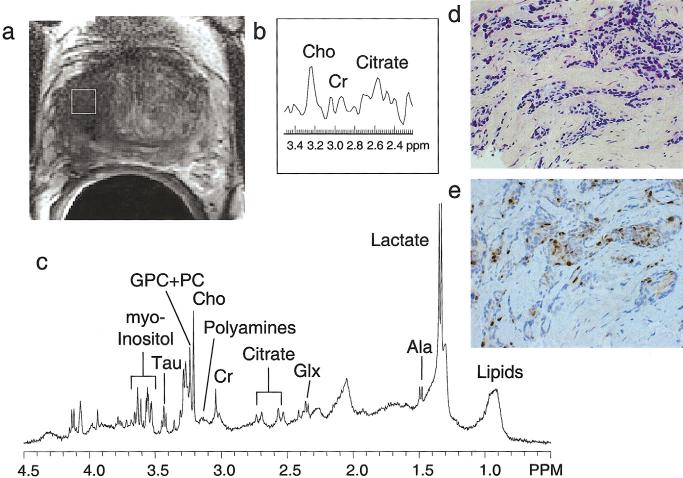
Magnetic resonance spectroscopic imaging (MRSI) provides a noninvasive method of detecting small molecular markers (historically the metabolites choline and citrate) within the cytosol and extracellular spaces of the prostate, and is performed in conjunction with high-resolution anatomic imaging. Recent studies in pre-prostatectomy patients have indicated that the metabolic information provided by MRSI combined with the anatomical information provided by MRI can significantly improve the assessment of cancer location and extent within the prostate, extracapsular spread, and cancer aggressiveness. Additionally, pre- and post-therapy studies have demonstrated the potential of MRI/MRSI to provide a direct measure of the presence and spatial extent of prostate cancer after therapy, a measure of the time course of response, and information concerning the mechanism of therapeutic response. In addition to detecting metabolic biomarkers of disease behavior and therapeutic response, MRI/MRSI guidance can improve tissue selection for ex vivo analysis. High-resolution magic angle spinning ((1)H HR-MAS) spectroscopy provides a full chemical analysis of MRI/MRSI-targeted tissues prior to pathologic and immunohistochemical analyses of the same tissue. Preliminary (1)H HR-MAS spectroscopy studies have already identified unique spectral patterns for healthy glandular and stromal tissues and prostate cancer, determined the composition of the composite in vivo choline peak, and identified the polyamine spermine as a new metabolic marker of prostate cancer. The addition of imaging sequences that provide other functional information within the same exam (dynamic contrast uptake imaging and diffusion-weighted imaging) have also demonstrated the potential to further increase the accuracy of prostate cancer detection and characterization.


Figures

Figure 1
Figure 1
Comparison of axial endorectal coil/pelvic phased array FSE prostate images (a) before and (b) after analytic correction for the reception profiles of the endorectal and pelvic phased array coils. In the corrected image, the high signal intensity close to the endorectal coil has been removed, allowing for improved visualization of prostate cancer (low T2 signal intensity, white arrows) compared to adjacent healthy prostate peripheral zone (high T2 signal intensity). Additionally, important anatomical features such as the prostatic capsule and the step-off angle in the prostatic capsule on the left side of the image (b) identifying extracapsular spread (black arrow) can be more clearly visualized.
Figure 2
Figure 2
a: A representative reception-profile corrected T2-weighted FSE axial image taken from a volume data set demonstrating a large tumor in the right midgland to base (same patient as in Fig. 1). The selected volume for spectroscopy (bold white box) and a portion of the 16 × 8 × 8 spectral phase-encode grid from one of eight axial spectroscopic slices is shown overlaid (fine white line) on (b) the T2-weighted image with (c) the corresponding 0.3 cm3 proton spectral array. Spectra in (d, red box) regions of cancer demonstrate dramatically elevated choline, and a reduction or absence of citrate and polyamines relative to (e, green box) regions of healthy peripheral zone tissue. In this fashion, metabolic abnormalities can be correlated with anatomic abnormalities from throughout the prostate. The strength of the combined MRI/MRSI exam is demonstrated when changes in all three metabolic markers (choline, polyamines, and citrate) and imaging findings are concordant for cancer. The focus of future studies will be to increase the number of metabolic markers and to better understand the cause of these changes through correlation with earlier protein and genetic changes.
Figure 3
Figure 3
a: Coronal T2-weighted FSE image of the same prostate cancer patient shown in Fig. 2. b: Coronal image with overlying spectroscopic selected volume (bold white box) and phase-encode grid (fine white line) taken from a portion of the 3-D array of spectra and (c) corresponding 0.3-cm3 proton spectra. The coronal slice is taken at the level of the peripheral zone, and MRI/MRSI (red arrows and outlined grid) are concordant for a large volume of tumor involving all of the right peripheral zone from apex to base and extending into the right seminal vesicles (black arrows). The metabolic pattern in the region of cancer is characteristic of a high Gleason score.
Figure 4
Figure 4
a: A T2-weighted weighted axial image and corresponding spectral array from the apex of a patient who had an elevated PSA (6.0 ng/ml) but negative prior biopsy. A small focus of low T2 signal intensity in the left peripheral zone indicated cancer. The MRSI spectral array was not optimally aligned with the peripheral zone and the MRI abnormality was split between two voxels, yielding a borderline metabolic abnormality. b: During postprocessing the spectral array was shifted downward such that the MRI abnormality was centered in a spectroscopic voxel (red box) yielding a clear-cut metabolic abnormality (choline+creatine)/citrate peak area ratio greater then 3 SDs above normal values. A subsequent TRUS-guided biopsy confirmed the presence of cancer.
Figure 5
Figure 5
a: A representative reception profile corrected T2-weighted MR image taken from the midgland of a 55-year-old prostate cancer patient with a current PSA of 0.6 ng/ml who had received intensity-modulated radiation therapy in June 2000. A portion of the 16 × 8 × 8 spectral phase-encode grid from one of eight axial slices is shown overlaid on (a) the T2-weighted image with (b) the corresponding 0.3 cm3 proton spectral array. The presence of cancer in the left lateral aspect of the prostate (right side of image) was subsequently confirmed by ultrasound-guided biopsies.
Figure 6
Figure 6
a: T2-weighted image and corresponding 0.3-cm3 spectral array from a 77-year-old patient with bilateral Gleason 3+4 cancer after 1 year of combined (Lupron and Casodex) hormone deprivation therapy. PSA was 0.4 ng/ml at the time of the MRI/MRSI scan. b: A corresponding T2-weighted image and spectral array from the same patient 1 year after cessation of hormone deprivation therapy. Metabolism and PSA (4.5 ng/ml) have significantly recovered, and bilateral recurrent cancer is identified by MRSI.
Figure 7
Figure 7
a T2-weighted MRI image and b: in vivo MRSI spectrum concordant for the presence of prostate cancer at the right base (left side of image). c Ex vivo 1H HR-MAS spectrum. d H&E stain, and e MIB-1 immunohistochemical stain of a single piece of prostate cancer tissue (Gleason 3 + 3) resected from this region.

Similar articles

Cited by

References

    1. American Cancer Society . American Cancer Society Inc, Surveillance Research; 2002. Website: www.cancer.org.
    1. Han M, Partin AW, Piantadosi S, Epstein JI, Walsh PC. Era specific biochemical recurrence-free survival following radical prostatectomy for clinically localized prostate cancer. J Urol. 2001;166:416–419. - PubMed
    1. Stamey TA. Cancer of the prostate: an analysis of some important contributions and dilemmas. Mono Urol. 1982;3:67–94.
    1. McNeal JE, Kindrachuk RA, Freiha FS, Bostwick DG, Redwine EA, Stamey TA. Patterns of progression in prostate cancer. Lancet. 1986;1:60–63. - PubMed
    1. Quinlan DM, Partin AW, Walsh PC. Can aggressive prostatic carcinomas be identified and can their natural history be altered by treatment? Urology. 1995;46:77–82. - PubMed

Publication types