

Genomewide linkage analysis of body mass index across 28 years of the Framingham Heart Study
- PMID: 12355400
- PMCID: PMC385083
- DOI: 10.1086/343822
Genomewide linkage analysis of body mass index across 28 years of the Framingham Heart Study
Abstract
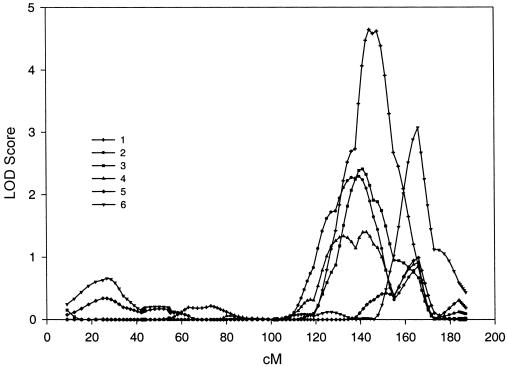
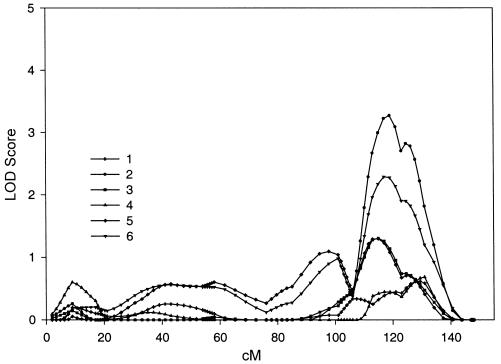
We performed a genomewide linkage analysis of six separate measurements of body mass index (BMI) taken over a span of 28 years, from 1971 to 1998, in the Framingham Heart Study. Variance-components linkage analysis was performed on 330 families, using 401 polymorphic markers. The number of individuals with data at each exam ranged from 1,930, in 1971, to 1,401, in 1998. Sex, age, and age squared were included as covariates in the model. There was substantial evidence for linkage on chromosome 6q23-25, in the area of D6S1009, GATA184A08, D6S2436, and D6S305. The six measurements had maximum LOD scores of 4.64, 2.29, 2.41, 1.40, 0.99, and 3.08, respectively, all in the chromosome 6q23-25 region. There was also evidence for linkage of multiple measures on chromosome 11q14 in the area of D11S1998, D11S4464, and D11S912. The six measurements had maximum LOD scores of 0.61, 3.27, 1.30, 0.68, 1.30, and 2.29, respectively, all in the chromosome 11q14 region. Both of these regions have been reported in previous studies. Evidence in the same regions from multiple measurements does not constitute replication; however, it does indicate that linkage studies of BMI are robust with respect to measurement error. It is unclear whether the variation in LOD scores in these regions is due to age effects, varying sample size, or other confounding factors.
Figures
References
Electronic-Database Information
-
- Online Mendelian Inheritance in Man (OMIM), http://www.ncbi.nlm.nih.gov/Omim/ (for obesity [MIM #601665])
References
-
- Cupples LA, D'Agostino RB, Kiely D (1988) The Framingham Heart Study, section 35: an epidemiological investigation of cardiovascular disease survival following cardiovascular events: 30 year follow-up. National Heart, Lung, and Blood Institute, Bethesda, MD
Publication types
MeSH terms
Associated data
- Actions
Grants and funding
LinkOut - more resources
Full Text Sources
Other Literature Sources
Molecular Biology Databases
