. 2002 Oct 1;21(19):5173-83.
doi: 10.1093/emboj/cdf485.

Mot1p is essential for TBP recruitment to selected promoters during in vivo gene activation

Affiliations

Mot1p is essential for TBP recruitment to selected promoters during in vivo gene activation

Jean-Christophe Andrau et al. EMBO J. .

Abstract

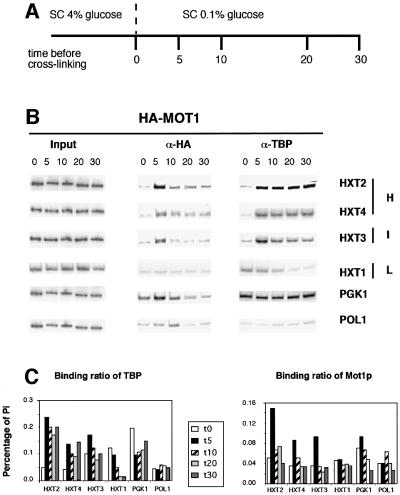
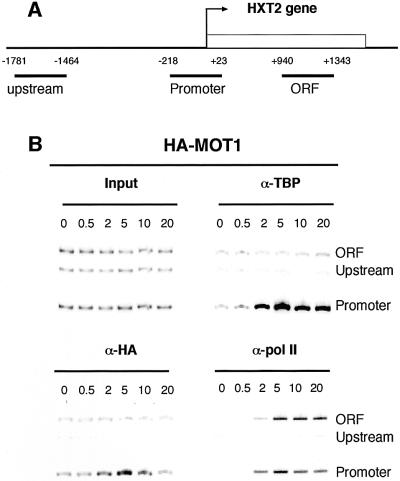
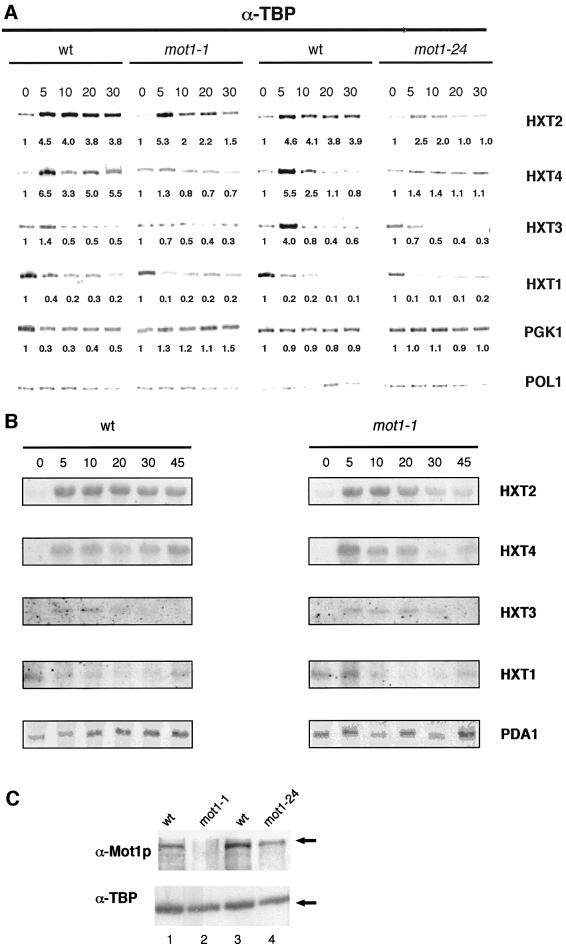
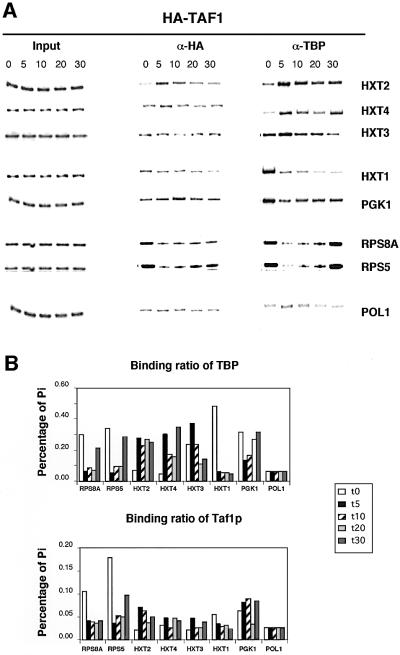
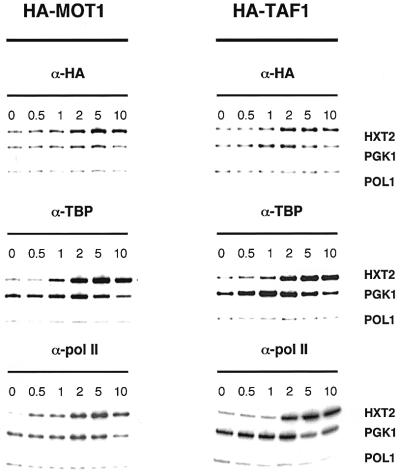
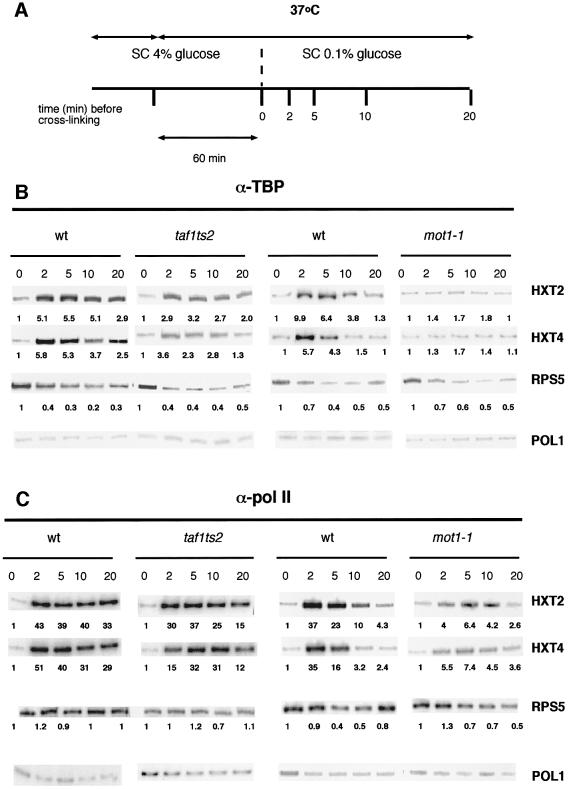
Recruitment of TATA-binding protein (TBP) is central to activation of transcription by RNA polymerase II (pol II). This depends upon co-activator proteins including TBP-associated factors (TAFs). Yeast Mot1p was identified as a general transcriptional repressor in genetic screens and is also found associated with TBP. To obtain insight into Mot1p function in vivo, we determined the mRNA expression profile of the mot1-1 temperature-sensitive (Ts) strain. Unexpectedly, this indicated that Mot1p mostly plays a positive role for transcription. For one potential activation target, HXT2, we analyzed promoter recruitment of Mot1p, TBP, Taf1p (Taf130p) and pol II by chromatin immunoprecipitation assays. Whereas TBP becomes stably associated upon activation of the HXT2 and HXT4 promoters, Mot1p showed only a transient association. TBP recruitment was compromised in two different mot1 mutant strains, but was only moderately affected in a taf1 Ts strain. Together, our data indicate that Mot1p can assist in recruitment of TBP on promoters during gene activation in vivo.


Figures

None
Fig. 1. Association of TBP and Mot1p to promoters in vivo after a glucose concentration shift. (A) Schematic representation of the experimental procedure. HA3-MOT1 cells were grown in 4% glucose SC medium. Log-phase cells were either immediately cross-linked (t = 0) with 1% formaldehyde or rinsed and transferred to a medium containing 0.1% glucose for the indicated times, followed by cross-linking. (B) PCR analysis of input and immunoprecipitated DNA during the glucose concentration shift. In each case, several amounts of input material were used to ensure that PCR signals were in the linear range of the reaction. Immunoprecipitated DNA was analyzed by multiplex PCRs including the POLI pair as the internal control. Panels for individual promoters are shown and represent similar exposures as normalized on the POLI control. The glucose affinity of each HXT transporter (H, high; I, intermediate; L, low) is represented on the right. Time is indicated in minutes. (C) PhosphorImager quantification of the data presented in (B). Pi value represents the immunoprecipitated signal divided by its corresponding input.
None
Fig. 2. TBP and Mot1p specifically co-localize on the promoter of HXT2. (A) Location of the PCR products on the HXT2 genomic region used for multiplex PCR analysis. The start site of translation is indicated by +1. (B) Using a slighty modified procedure as compared with Figure 1 (see Materials and methods), cells were transferred from 4 to 0.1% glucose for the indicated times (in minutes) before cross-linking, extract preparation and immunoprecipitation. Analysis of the corresponding input samples indicated that the signals were in the linear range of the PCR.
None
Fig. 3. Both TBP occupancy and transcription of HXT genes are impaired in strains carrying mot1 mutant alleles. (A) ChIP analysis of TBP binding in the mot1-1 and mot1-24 strains. The experimental design is similar to Figure 1. The respective cultures grown at the permissive temperature were sampled at t = 0, 5, 10, 20 and 30 min after a shift from 4 to 0.1% glucose media. The numbers below the autoradiograms represent the fold change in TBP occupancy relative to the t = 0 control. (B) RNA expression of HXT genes upon glucose shift. Cells were grown as in (A), harvested and frozen before RNA extraction. An additional time point (45 min after glucose shift) was collected. Specific mRNAs were detected using specific oligonucleotide probes, described previously (Diderich et al., 1999). PDA1 transcripts were used as an internal control. (C) Immunoblot analysis of Mot1p and TBP in chromatin preparations. Cells were cultured in SC 4% glucose and chromatin was prepared from KY804 (lane 1), MY603 (lane 2), FY142 (lane 3) and FY1211 (lane 4). After cross-link reversal, immunoblots were prepared and analyzed with anti-TBP and anti-Mot1p antisera. The arrows indicate positions of TBP and Mot1p.
None
Fig. 4. Kinetics of Taf1p binding to promoters in vivo after a glucose concentration shift. (A) ChIP analyses of TBP and Taf1p promoter occupancy using a yeast strain carrying a HA3-tagged TAF1 gene were performed as described in Figure 1B. RPS5 and RPS8A are used as standards for TAF-dependent genes, whereas PGK1 is TAF independent. (B) PhosphorImager quantification of the immunoprecipitation efficiency. This is expressed as Pi, which was determined as in Figure 1C.
None
Fig. 5. Early events of HXT2 promoter activation. ChIP analysis of HA3-Mot1p, HA3-Taf1p, TBP and pol II very rapidly after a glucose concentration shift. This experiment was performed using the HA3-MOT1 (left) and HA3-TAF1 (right) strains. TBP binding was determined to check the correspondence of results between the two strains. Analysis of input extract showed linearity of the PCR (data not shown). The glucose concentration shift procedure was performed as in Figure 2.
None
Fig. 6. Inactivation of Mot1p, but not of Taf1p, abolishes TBP recruitment to the HXT2 and HXT4 promoters. (A) Schematic representation of the experimental procedure. Yeast cultures were rapidly shifted to 37°C prior to the glucose shift, after which cross-linking was initiated at the indicated time points. (B) TBP recruitment to the indicated genes was determined by ChIP analysis very rapidly after glucose shift in mot1-1 and taf1ts2 Ts strains under non-permissive temperatures. Yeast cells were grown in SC 4% glucose at 23°C (taf1ts2) or at 30°C (mot1-1). Log-phase cultures were shifted to 37°C for 1 h, after which the glucose concentration was reduced to 0.1% following the rapid-shift protocol of Figure 2. The numbers below the autoradiograms represent the fold change in TBP occupancy relative to the t = 0 time point. (C) Pol II recruitment to the indicated genes was determined by ChIP analysis very rapidly after glucose shift. The numbers below the autoradiograms represent the fold change in pol II occupancy relative to the t = 0 time point.

Similar articles

Cited by

References

    1. Adamkewicz J.I., Hansen,K.E., Prud’homme,W.A., Davis,J.L. and Thorner,J. (2001) High affinity interaction of yeast transcriptional regulator, Mot1, with TATA-box binding protein (TBP). J. Biol. Chem., 276, 11883–11894. - PubMed
    1. Auble D.T., Hansen,K.E., Mueller,C.G.F., Lane,W.S., Thorner,J. and Hahn,S. (1994) Mot1, a global repressor of RNA polymerase II transcription, inhibits TBP binding to DNA by an ATP-dependent mechanism. Genes Dev., 8, 1920–1934. - PubMed
    1. Bai Y., Perez,G.M., Beechem,J.M. and Weil,P.A. (1997) Structure– function analysis of TAF130: identification and characterization of a high-affinity TATA-binding protein interaction domain in the N-terminus of yeast TAFII130. Mol. Cell. Biol., 17, 3081–3093. - PMC - PubMed
    1. Chao D.M. and Young,R.A. (1996) Activation without a vital ingredient. Nature, 383, 119–120. - PubMed
    1. Collart M.A. (1996) The NOT, SPT3, and MOT1 genes functionally interact to regulate transcription at core promoters. Mol. Cell. Biol., 16, 6668–6676. - PMC - PubMed

Publication types

MeSH terms

Substances