. 2002 Oct 1;21(19):5195-205.
doi: 10.1093/emboj/cdf506.

Chk2-deficient mice exhibit radioresistance and defective p53-mediated transcription

Affiliations

Chk2-deficient mice exhibit radioresistance and defective p53-mediated transcription

Hiroyuki Takai et al. EMBO J. .

Abstract

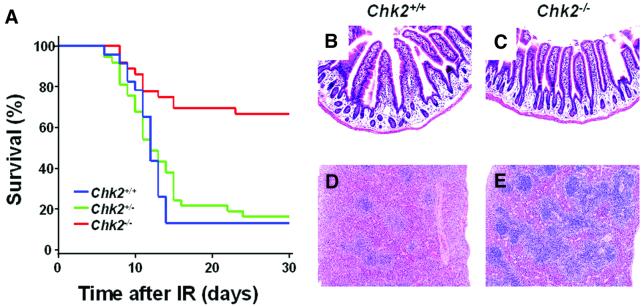
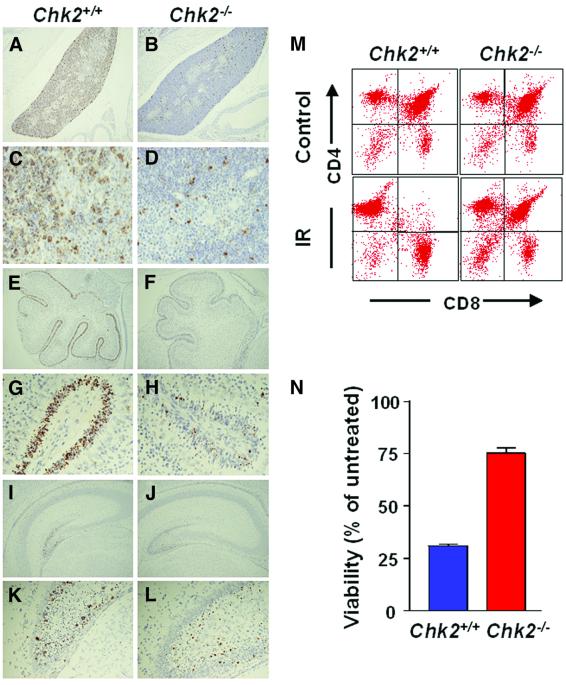
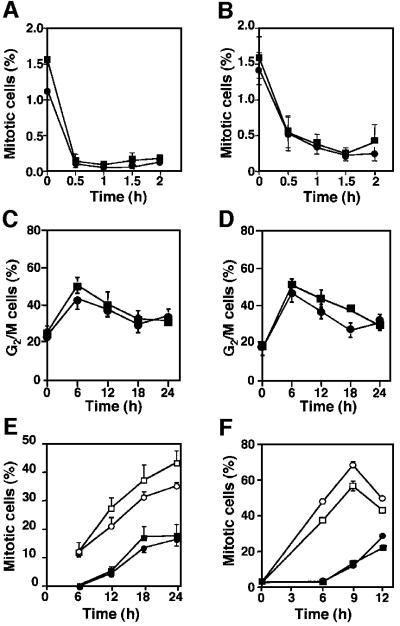
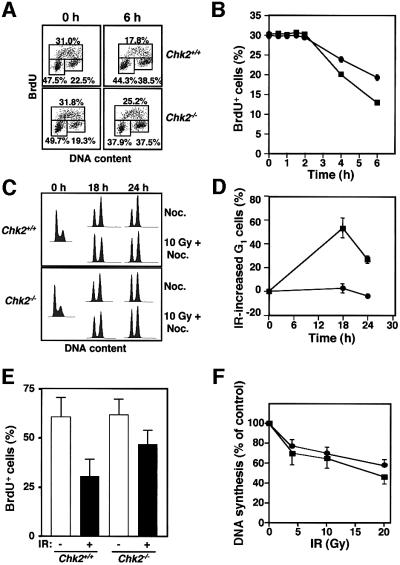
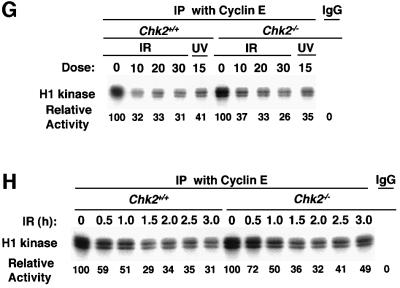
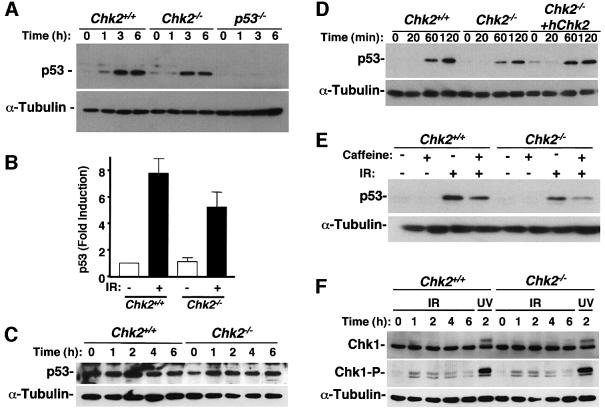
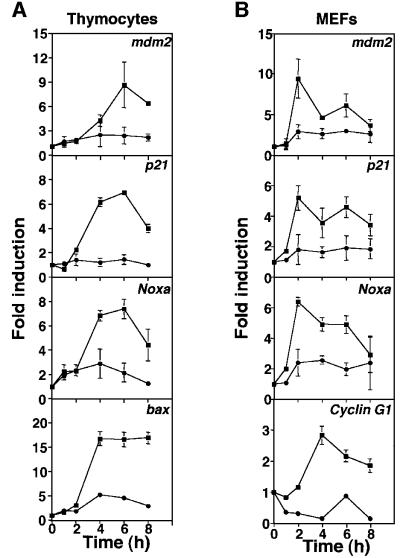
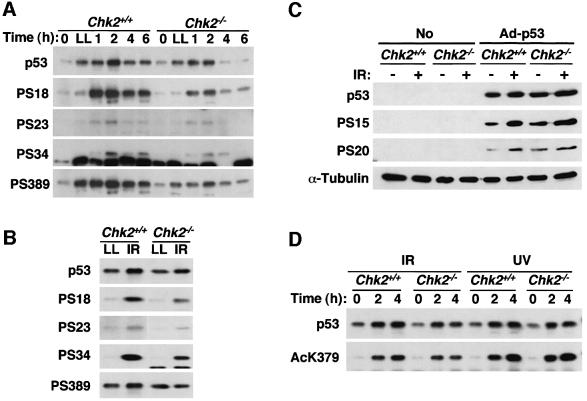
The mammalian Chk2 kinase is thought to mediate ATM-dependent signaling in response to DNA damage. The physiological role of mammalian Chk2 has now been investigated by the generation of Chk2-deficient mice. Although Chk2(-/-) mice appeared normal, they were resistant to ionizing radiation (IR) as a result of the preservation of splenic lymphocytes. Thymocytes and neurons of the developing brain were also resistant to IR-induced apoptosis. The IR-induced G(1)/S cell cycle checkpoint, but not the G(2)/M or S phase checkpoints, was impaired in embryonic fibroblasts derived from Chk2(-/-) mice. IR-induced stabilization of p53 in Chk2(-/- )cells was 50-70% of that in wild-type cells. Caffeine further reduced p53 accumulation, suggesting the existence of an ATM/ATR-dependent but Chk2-independent pathway for p53 stabilization. In spite of p53 protein stabilization and phosphorylation of Ser23, p53-dependent transcriptional induction of target genes, such as p21 and Noxa, was not observed in Chk2(-/-) cells. Our results show that Chk2 plays a critical role in p53 function in response to IR by regulating its transcriptional activity as well as its stability.


Figures

None
Fig. 1. Reduced radiosensitivity of Chk2–/– mice and Chk2–/– splenocytes in vivo. (A) Kaplan–Meier survival curve of age-matched 8–16-week-old Chk2+/+ (n = 23), Chk2+/– (n = 37) and Chk2–/– (n = 36) mice after exposure to 8 Gy of X-rays. Data are combined from two separate experiments. (B and C) Normal appearance of intestine in Chk2+/+ (B) and Chk2–/– (C) mice 1 day after IR. (D and E) Atrophy of white pulp of the spleen and reduction of splenocyte number in Chk2+/+ mice (D), but not in Chk2–/– mice (E), 8 days after exposure to IR.
None
Fig. 2. Defective IR-induced apoptosis in the thymus and developing brain of Chk2–/– mice. (AD) TUNEL staining of thymi derived from 2- to 3-month-old Chk2+/+ (A and C) and Chk2–/– (B and D) mice 9 h after exposure to 8 Gy of IR. Magnification: 4× (A and B) or 40× (C and D). (EL) TUNEL staining of the cerebellum from Chk2+/+ (E and G), Chk2–/– (F and H) mice and of the hippocampus from Chk2+/+ (I and K) and Chk2–/– (J and L) mice at 4 days of age and 9 h after exposure to 8 Gy of IR. Magnification: 10× (E, F, I and J) or 40× (G, H, K and L). (M) Flow cytometric analysis of thymocytes isolated from control Chk2+/+ and Chk2–/– mice or from irradiated animals 24 h after exposure to 4 Gy of IR. The cells were stained for CD4 and CD8. (N) Sensitivity of isolated thymocytes to IR. Thymocytes derived from Chk2+/+ and Chk2–/– mice were exposed to 4 Gy of IR and cultured for 24 h before determining viability by staining with propidium iodide and flow cytometry. Data are expressed as a percentage of the viability of the corresponding non-irradiated cells and are means ± standard deviation from three independent experiments.
None
Fig. 3. Normal G2/M checkpoint activation in Chk2–/– mice. (A and B) Activation of the G2/M checkpoint. Mitotic index of irradiated or unirradiated Chk2+/+ (squares) and Chk2–/– (circles) MEFs (A) and ES cells (B) was determined at the indicated times after 10 Gy IR. Data are expressed as the percentage of mitotic cells of total cells; means ± standard deviation are from triplicate experiments. (C and D) The fraction of G2/M Chk2+/+ (squares) or Chk2–/– (circles) MEFs (C) or ES cells (D) was determined at the indicated times after 10 Gy IR. The means ± standard deviation from three independent experiments are given. (E and F) Maintenance of the G2/M checkpoint. Irradiated (closed symbols) and unirradiated (open symbols) Chk2+/+ (squares) and Chk2–/– (circles) MEFs (E) and ES cells (F) were treated with 0.2 µg/ml nocodazole, and the percentage of mitotic cells was determined at the indicated times after 10 Gy IR. Means ± standard deviation from replicate (n = 4) (E) or triplicate (F) experiments are given.
None
Fig. 4. Defective G1, but not S phase, checkpoint activation in Chk2–/– mice. (A) Representive data of dot-plots of BrdU fluorescence versus DNA content for Chk2+/+ or Chk2–/– MEFs at the times indicated after 10 Gy IR. Irradiated and unirradiated MEFs were treated with 10 µM BrdU for 30 min before cells were harvested and analyzed by flow cytometry. (B) The percentage of total cells that were BrdU positive from Chk2+/+ (squares) or Chk2–/– (circles) MEFs as described in (A); the means ± standard deviation are from triplicate experiments. (C) Representative histograms show DNA content of Chk2+/+ or Chk2–/– MEFs at the times indicated after 10 Gy IR. Cells were treated with 1 mg/ml nocodazole, and at the indicated time points after IR, they were harvested and analyzed by flow cytometry. (D) A summary of triplicate experiments as described in (C). The percentage increase in G1 is the difference in the percent G1 content between irradiated and unirradiated Chk2+/+ (squares) or Chk2–/– (circles) control cells, respectively. (E) Defective ability of Chk2–/– MEFs to block S phase entry following 20 Gy IR. Serum-starved MEFs were released from G1 arrest into complete medium containing BrdU (65 µM) and immediately subjected (or not) to irradiation. Cells were harvested 24 h after release and the number of BrdU positive cells was determined as a percentage of total cells by flow cytometry. Data are means ± standard deviation of values from replicate experiments (n = 4). (F) Normal S phase checkpoint activation in Chk2–/– MEFs. Replicative DNA synthesis was assessed 1 h after the indicated doses of IR in Chk2+/+ (squares) or Chk2–/– (circles) MEFs. (G and H) The activity of cyclin E-associated Cdk2 at 2 h after IR at the indicated dose (Gy) or after 15 J/m2 UV and (G) at the times indicated after IR (20 Gy) (H). Relative kinase activities are indicated at the bottom.
None
Fig. 5. IR-induced stabilization of p53 in Chk2–/– thymocytes, MEFs and ES cells. (A) Immunoblot analysis of the time course of p53 abundance after exposure of thymocytes from Chk2+/+, Chk2–/– and p53–/– mice to IR (5 Gy). (B) Quantitation of p53 abundance 4 h after exposure of Chk2+/+ or Chk2–/– thymocytes to IR as in (A). Data are expressed as fold induction relative to the amount of p53 in non-irradiated cells and are means ± standard deviation of values from five independent experiments. (C) Protein levels of p53 in MEFs from Chk2+/+ or Chk2–/– mice harvested at the indicated times after 10 Gy IR. (D) Effect of expression of recombinant human Chk2 on the IR-induced stabilization of p53 in Chk2–/– ES cells. (E) Stabilization of p53 protein after IR is dependent on a caffeine-sensitive pathway in Chk2–/– cells. Chk2+/+ and Chk2–/– ES cells were pre-treated with or without 5 mM caffeine for 1 h and cell lysates were made 2 h after IR. (F) Activation of Chk1 in response to IR. Immunoblot analysis of the time course of Chk1 and Ser345-phosphorylated Chk1 in Chk2+/+ or Chk2–/– MEFs after IR (10 Gy) or UV irradiation (50 J/m2).
None
Fig. 6. Defective induction of p53-regulated genes. The fold induction of mRNAs of p53-regulated genes in thymocytes (A) and MEFs (B) from Chk2+/+ (squares) and Chk2–/– (circles) mice in response to IR. Real-time, quantitative RT–PCR analyses of the expression of Cdkn1a (p21), Pmaip1 (Noxa), Ccng (cyclin G1), Mdm2 and Bax following 5 or 10 Gy of IR in Chk2+/+ or Chk2–/– thymocytes or MEFs, respectively. Expression levels of Gapd (GAPDH) were monitored as an internal control, and data were normalized to Gapd levels. The data are expressed as fold induction by IR and are means ± standard deviation from three independent experiments.
None
Fig. 7. Phosphorylation and acetylation of p53 protein in Chk2–/– cells after IR. (A) ES cells were exposed to 10 Gy IR or treated with 10 µM of LLnL (LL) and then lysed at the indicated times after treatment. Immunoprecipitates prepared with PAb421 were subjected to immunoblot analysis with the p53-specific antibodies PAb421 and PAb240 (p53) or with antibodies specific for p53 phosphorylated on the indicated serine residues (PS18, PS23, PS34 or PS389). (B) Similar amounts of p53 protein from irradiated or LLnL (LL)-treated ES cells harvested 2 or 4 h after treatment, respectively, were subjected to immunoblot analysis of p53 as in (A). (CChk2+/+ and Chk2–/– MEFs infected with or without adenovirus-expressing human p53 were cultured for 24 h, the cells were exposed (or not) to 10 Gy IR and then lysed 2 h after IR. Total cell lysates were analyzed by immunoblot using either the human p53-specific monoclonal antibodiy DO-1 (p53), phosphoserine-specific antibodies [anti-human p53 PabSer(P)15 (PS15) and anti-PAb(P)20 (PS20)] or anti-α-tubulin as probes. (D) Differentiated ES cells were exposed to IR (10 Gy) or UV light (50 J/m2) and lysed at the indicated times after treatment. Immunoprecipitates prepared with PAb421 antibodies were subject to immunoblot analysis with p53-specific PAb421 and PAb240 or with antibodies specific for p53 acetylated on lysine379 (AcK379).

Comment in

  • CHK2: a tumor suppressor or not?
    McGowan CH. McGowan CH. Cell Cycle. 2002 Nov-Dec;1(6):401-3. doi: 10.4161/cc.1.6.264. Cell Cycle. 2002. PMID: 12548013 Review. No abstract available.

Similar articles

Cited by

References

    1. Appella E. and Anderson,C.W. (2001) Post-translational modifications and activation of p53 by genotoxic stresses. Eur. J. Biochem., 268, 2764–2772. - PubMed
    1. Ashcroft M., Kubbutat,M.H. and Vousden,K.H. (1999) Regulation of p53 function and stability by phosphorylation. Mol. Cell. Biol., 19, 1751–1758. - PMC - PubMed
    1. Banin S. et al. (1998) Enhanced phosphorylation of p53 by ATM in response to DNA damage. Science, 281, 1674–1677. - PubMed
    1. Barlow C. et al. (1996) Atm-deficient mice: a paradigm of ataxia telangiectasia. Cell, 86, 159–171. - PubMed
    1. Barlow C., Brown,K.D., Deng,C.X., Tagle,D.A. and Wynshaw-Boris,A. (1997) Atm selectively regulates distinct p53-dependent cell-cycle checkpoint and apoptotic pathways. Nat. Genet., 17, 453–456. - PubMed

Publication types

MeSH terms