

Hemoprotein Bach1 regulates enhancer availability of heme oxygenase-1 gene
- PMID: 12356737
- PMCID: PMC129038
- DOI: 10.1093/emboj/cdf516
Hemoprotein Bach1 regulates enhancer availability of heme oxygenase-1 gene
Abstract
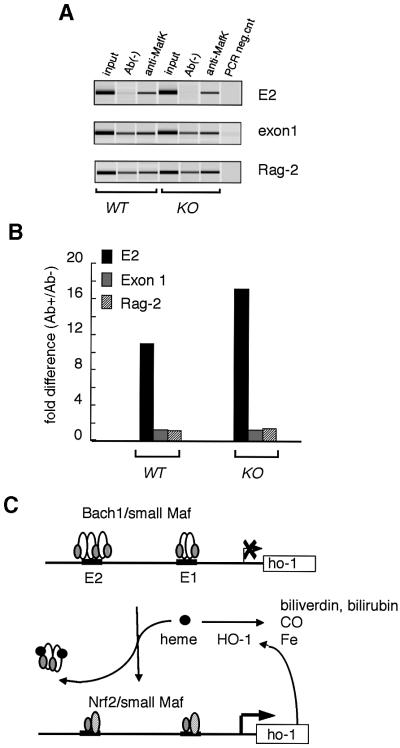
Heme oxygenase-1 (HO-1) protects cells from various insults including oxidative stress. Transcriptional activators, including the Nrf2/Maf heterodimer, have been the focus of studies on the inducible expression of ho-1. Here we show that a heme-binding factor, Bach1, is a critical physiological repressor of ho-1. Bach1 bound to the multiple Maf recognition elements (MAREs) of ho-1 enhancers with MafK in vitro and repressed their activity in vivo, while heme abrogated this repressor function of Bach1 by inhibiting its binding to the ho-1 enhancers. Gene targeting experiments in mice revealed that, in the absence of Bach1, ho-1 became expressed constitutively at high levels in various tissues under normal physiological conditions. By analyzing bach1/nrf2 compound-deficient mice, we documented antagonistic activities of Bach1 and Nrf2 in several tissues. Chromatin immunoprecipitation revealed that small Maf proteins participate in both repression and activation of ho-1. Thus, regulation of ho-1 involves a direct sensing of heme levels by Bach1 (by analogy to lac repressor sensitivity to lactose), generating a simple feedback loop whereby the substrate effects repressor-activator antagonism.
Figures


Similar articles
-
Bach1 functions as a hypoxia-inducible repressor for the heme oxygenase-1 gene in human cells.J Biol Chem. 2003 Mar 14;278(11):9125-33. doi: 10.1074/jbc.M209939200. Epub 2003 Jan 2. J Biol Chem. 2003. PMID: 12511571
-
Cadmium induces nuclear export of Bach1, a transcriptional repressor of heme oxygenase-1 gene.J Biol Chem. 2003 Dec 5;278(49):49246-53. doi: 10.1074/jbc.M306764200. Epub 2003 Sep 22. J Biol Chem. 2003. PMID: 14504288
-
Dynamic cytoplasmic anchoring of the transcription factor Bach1 by intracellular hyaluronic acid binding protein IHABP.J Biochem. 2005 Mar;137(3):287-96. doi: 10.1093/jb/mvi031. J Biochem. 2005. PMID: 15809329
-
The heme oxygenase dilemma in cellular homeostasis: new insights for the feedback regulation of heme catabolism.Tohoku J Exp Med. 2003 Aug;200(4):167-86. doi: 10.1620/tjem.200.167. Tohoku J Exp Med. 2003. PMID: 14580148 Review.
-
[Heme metabolism in stress response].Nihon Eiseigaku Zasshi. 2002 Jan;56(4):615-21. doi: 10.1265/jjh.56.615. Nihon Eiseigaku Zasshi. 2002. PMID: 11868390 Review. Japanese.
Cited by
-
MicroRNAs, hepatitis C virus, and HCV/HIV-1 co-infection: new insights in pathogenesis and therapy.Viruses. 2012 Oct 26;4(11):2485-513. doi: 10.3390/v4112485. Viruses. 2012. PMID: 23202492 Free PMC article. Review.
-
Heme Oxygenase-1 Signaling and Redox Homeostasis in Physiopathological Conditions.Biomolecules. 2021 Apr 16;11(4):589. doi: 10.3390/biom11040589. Biomolecules. 2021. PMID: 33923744 Free PMC article. Review.
-
Heme Oxygenase-1, Cardiac Senescence, and Myocardial Infarction: A Critical Review of the Triptych.Cardiovasc Drugs Ther. 2024 Jun 28. doi: 10.1007/s10557-024-07590-0. Online ahead of print. Cardiovasc Drugs Ther. 2024. PMID: 38940935 Review.
-
Heme Oxygenase-1 and Carbon Monoxide in the Heart: The Balancing Act Between Danger Signaling and Pro-Survival.Circ Res. 2016 Jun 10;118(12):1940-1959. doi: 10.1161/CIRCRESAHA.116.306588. Circ Res. 2016. PMID: 27283533 Free PMC article. Review.
-
Metabolic sensing and control in mitochondria.Mol Cell. 2023 Mar 16;83(6):877-889. doi: 10.1016/j.molcel.2023.02.016. Mol Cell. 2023. PMID: 36931256 Free PMC article. Review.
References
-
- Alam J. (1994) Multiple elements within the 5′ distal enhancer of the mouse heme oxygenase-1 gene mediate induction by heavy metals. J. Biol. Chem., 269, 25049–25056. - PubMed
-
- Alam J., Shibahara,S. and Smith,A. (1989) Transcriptional activation of the heme oxygenase gene by heme and cadmium in mouse hepatoma cells. J. Biol. Chem., 264, 6371–6375. - PubMed
-
- Alam J., Camhi,S. and Choi,A.M.K. (1995) Identification of a second region upstream of the mouse heme oxygenase-1 gene that functions as a basal level and inducer-dependent transcription enhancer. J. Biol. Chem., 270, 11977–11984. - PubMed
-
- Alam J., Stewart,D., Touchard,C., Boinapally,S., Choi,A.M. and Cook,J.L. (2000a) Nrf2, a Cap’n’Collar transcription factor, regulates induction of the heme oxygenase-1 gene. J. Biol. Chem., 274, 26071–26078. - PubMed
-
- Alam J., Wicks,C., Stewart,D., Gong,P., Touchard,C., Otterbein,S., Choi,A.M.K., Burow,M.E. and Tou,J. (2000b) Mechanism of heme oxygenase-1 gene activation by cadmium in MCF-7 mammary epithelial cells. Role of p38 kinase and Nrf2 transcription factor. J. Biol. Chem., 275, 27694–27702. - PubMed
Publication types
MeSH terms
Substances
LinkOut - more resources
Full Text Sources
Other Literature Sources
Molecular Biology Databases
Research Materials
Miscellaneous
