. 2002 Oct;120(4):497-508.
doi: 10.1085/jgp.20028573.

Extracellular protons regulate the extracellular cation selectivity of the sodium pump

Affiliations

Extracellular protons regulate the extracellular cation selectivity of the sodium pump

Mark A Milanick et al. J Gen Physiol. 2002 Oct.

Abstract

The effects of 0.3-10 nM extracellular protons (pH 9.5-8.0) on ouabain-sensitive rubidium influx were determined in 4,4'-diisocyanostilbene-2, 2'-disulfonate (DIDS)-treated human and rat erythrocytes. This treatment clamps the intracellular H. We found that rubidium binds much better to the protonated pump than the unprotonated pump; 13-fold better in rat and 34-fold better in human erythrocytes. This clearly shows that protons are not competing with rubidium in this proton concentration range. Bretylium and tetrapropylammonium also bind much better to the protonated pump than the unprotonated pump in human erythrocytes and in this sense they are potassium-like ions. In contrast, guanidinium and sodium bind about equally well to protonated and unprotonated pump in human red cells. In rat red cells, protons actually make sodium bind less well (about sevenfold). Thus, protons have substantially different effects on the binding of rubidium and sodium. The effect of protons on ouabain binding in rat red cells was intermediate between the effects of protons on rubidium binding and on sodium binding. Remarkably, all four cationic inhibitors (bretylium, guanidinium, sodium, and tetrapropylammonium) had similar apparent inhibitory constants for the unprotonated pump ( approximately 5-10 mM). The K(d) for proton binding to the human pump, with the empty transport site facing extracellularly is 13 nM, whereas the extracellular transport site loaded with sodium is 9.5 nM, and with rubidium is 0.38 nM. In rat red cells there is also a substantial difference in the K(d) for proton binding to the sodium-loaded pump (14.5 nM) and the rubidium-loaded pump (0.158 nM). These data suggest that important rearrangements occur at the extracellular pump surface as the pump moves between conformations in which the outward facing transport site has sodium bound, is empty, or has rubidium bound and that guanidinium is sodium-like and bretylium and tetrapropylammonium are rubidium-like.


Figures

F<sc>igure</sc> 7.
Figure 7.
Extracellular protons influence the inhibition by sodium more than the inhibition by tetrapropylammonium. Ouabain-sensitive 86Rb influx was determined as described in materials and methods in DIDS-treated red blood cells. Shown are the mean and standard deviation of a representative experiment of a total of three that were done under these conditions. In this experiment, the slope in the absence of inhibitor (circle) was 0.447 ± 0.055, in the presence of 0.5 mM tetrapropylammonium (triangle) was 0.149 ± 0.032, and in the presence of 22.5 mM sodium (square) was 0.212 ± 0.006. The slope of flux versus proton concentration was statistically significantly different for tetrapropylammonium and for sodium in all three experiments.
F<sc>igure</sc> 3.
Figure 3.
Extracellular proton activation of 86Rb influx at different inhibitor concentrations. Ouabain-sensitive 86Rb influx was determined as described in the methods in DIDS treated human red blood cells at 0.3 mM rubidium. Three complete experiments were run for each inhibitor, which included all the proton concentrations shown in the figures and all 4 inhibitor concentrations as indicated in each panel and the data pooled as indicated in the legend to Fig. 1.The data (not the means) were fit to the equation, v = H/[A + B × H] at each inhibitor concentration. The replots of A and B versus I are shown in Fig. 4, a and b.
F<sc>igure</sc> 1.
Figure 1.
Extracellular proton activation of 86Rb influx as a function of rubidium. Ouabain-sensitive Rb influx was determined as described in materials and methods in DIDS-treated red blood cells. The DIDS treatment effectively clamps the intracellular proton concentration, so that the observed effect is due to extracellular protons. Three complete experiments were run for both rat (a) and human (b) red cells. Each experiment included all the proton concentrations shown in the figures and all 4 rubidium concentrations as indicated in each panel. The data on each day were normalized to the flux at the highest proton and rubidium concentrations. The data from the 3 experiments were then pooled and the mean and standard deviations are shown. The data (not the means) were fit to the equation, v = H/[A + B × H] at each rubidium concentration. The replots of A and B versus 1/Rb are shown in Fig. 2.
F<sc>igure</sc> 2.
Figure 2.
Replot of A and B versus 1/[Rb]. The values of A and B were determined from the data in Fig. 1. The values for A have been normalized so that the y intercept is 1. By doing this, the slope of the line for A is proportional to KRb; in the rapid equilibrium case, this reflects rubidium binding to the unprotonated pump. As shown in materials and methods, the line for B is theoretically expected to have a y intercept of 1. The slope for B is proportional to LRb; in the rapid equilibrium case, this reflects rubidium binding to the protonated pump. Clearly, protons greatly increase the affinity of the pump for rubidium. The slopes were 0.868 ± 0.101 for A (open diamonds) and 0.066 ± 0.0059 for B (closed diamonds) for rat red blood cells (a) and were 1.32 ± 0.07 for A (open circles) and 0.0387 ± 0.0074 for B (closed circles) for human red blood cells (b).
F<sc>igure</sc> 4.
Figure 4.
(a) Replot of A for bretylium, guanidinium, sodium, and tetrapropylammonium versus inhibitor concentrations. The values of A were determined from the plots in Fig. 3. The slope of this line is proportional to the Ki for each inhibitor, for binding to the unprotonated pump. All four lines have similar slope, implying that all four inhibitors bind with similar affinity to the unprotonated pump. The slopes were: bretylium (triangles), 0.392 ± 0.078; guanidinium (diamonds), 0.175 ± 0.014; sodium (circles), 0.271 ± 0.037; tetrapropylammonium (squares), 0.364 ± 0.063. (b) Replot of B for bretylium, guanidinium, sodium, and tetrapropylammonium versus inhibitor concentrations. The values of B were determined from the plots in Fig. 3. The slope of this line is proportional to the Li for each inhibitor, for binding to the protonated pump. Clearly Na and guanidinium have very little affinity for the protonated pump and bretylium and TPA have substantial affinity. The slopes were: bretylium (triangles), 0.282 ± 0.019; guanidinium (diamonds), 0.016 ± 0.001; sodium (circles), 0.040 ± 0.006; tetrapropylammonium (squares), 0.517 ± 0.016.
F<sc>igure</sc> 5.
Figure 5.
The effect of ouabain and sodium on the proton activation of Rb influx in DIDS treated rat red blood cells. The experimental procedure was similar to that described in Fig. 3 and the results of 3 separate experiments pooled as described in Fig. 3. The data were fit to the equation, v = H/[A + B * H] at each inhibitor concentration (panels a and c) and the values of A and B replotted vs. I (panels b and d). Note that the x axis for ouabain is in micromolar in this panel b, reflecting the substantially higher affinity for ouabain than for the sodium and the inhibitors in Fig. 4. The slope for ouabain binding in the absence of protons was 0.0566 ± 0.0043 and in the presence of protons was 0.0124 ± 0.0023. The slope for ouabain binding in the absence of protons was 0.17 ± 0.011 and in the presence of protons was 0.12 ± 0.012.
F<sc>igure</sc> 6.
Figure 6.
The effect of protonation on the kinetic constants for bretylium, guanidinium, ouabain, rubidium, and sodium. The values of Ki and Li were calculated as indicated in the text and normalized to the value of Ki. The cations fall into two categories: category one includes tetrapropylammonium, bretylium, and rubidium. Their kinetic constants are substantially decreased by protonation. In a simple model where these kinetic constants reflect the affinity, this implies that protons make these ions bind much better. Category two includes guanidinium and sodium. In human, their kinetic constants are little changed by protonation; in rat, the kinetic constant for sodium is substantially increased. Ouabain is intermediate between sodium and rubidium in rat.
F<sc>igure</sc> 8.
Figure 8.
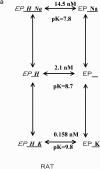
Reaction scheme for extracellular cations binding to the Na pump. The scheme depicted describes the enzyme conformation that has just translocated and released Na to the extracellular space. We have purposefully omitted references to E1 and E2 as they are sometimes used to describe different pump conformations. Also, this model assumes that rubidium and sodium are mutually exclusive. Rubidium binds much better to the protonated pump than the unprotonated pump, 13-fold better in rat (a) and 34-fold better in human (b). In contrast, sodium binds only 1.34-fold better to the protonated pump than the unprotonated pump in human. In rat, the effect of protons is in the opposite direction, making sodium bind sevenfold less well. In both species, the addition of protons greatly increases the selectivity of the pump for rubidium over sodium. Stated another way, the pK changes substantially in both species when rubidium binds instead of sodium. The reaction scheme shows the K d values for proton binding to the different cation loaded, outward facing, conformations and also the pK values. Values obtained from Figs. 2, 4, 5, and 6, using the equations in materials and methods as described in the text.

Similar articles

Cited by

References

    1. Apell, H.J., and S.J. Karlish. 2001. Functional properties of Na,K-ATPase, and their structural implications, as detected with biophysical techniques. J. Membr. Biol. 180:1–9. - PubMed
    1. Blostein, R. 1999. Jeanne Mannery Fisher Memorial Lecture 1998. Structure-function studies of the sodium pump. Biochem. Cell Biol. 77:1–10. - PubMed
    1. Breitweiser, G.E., A.A. Altamirano, and J.M. Russell. 1987. Effects of pH changes on sodium pump fluxes in squid giant axon. Am. J. Physiol. Cell Physiol. 253:C547–C554. - PubMed
    1. Cornelius, F., and J.C. Skou. 1985. Na+-Na+ exchange mediated by (Na+ + K+)-ATPase reconstituted into liposomes. Evaluation of pump stoichiometry and response to ATP and ADP. Biochim. Biophys. Acta. 818:211–221. - PubMed
    1. DeWeer, P., D.C. Gadsby, and R.F. Rakowski. 2001. Voltage dependence of the apparent affinity for external Na(+) of the backward-running sodium pump. J. Gen. Physiol. 117:315–328. - PMC - PubMed

Publication types