. 2002 Oct;120(4):567-79.
doi: 10.1085/jgp.20028665.

The effects of HCl and CaCl(2) injections on intracellular calcium and pH in voltage-clamped snail (Helix aspersa) neurons

Affiliations

The effects of HCl and CaCl(2) injections on intracellular calcium and pH in voltage-clamped snail (Helix aspersa) neurons

Roger C Thomas. J Gen Physiol. 2002 Oct.

Abstract

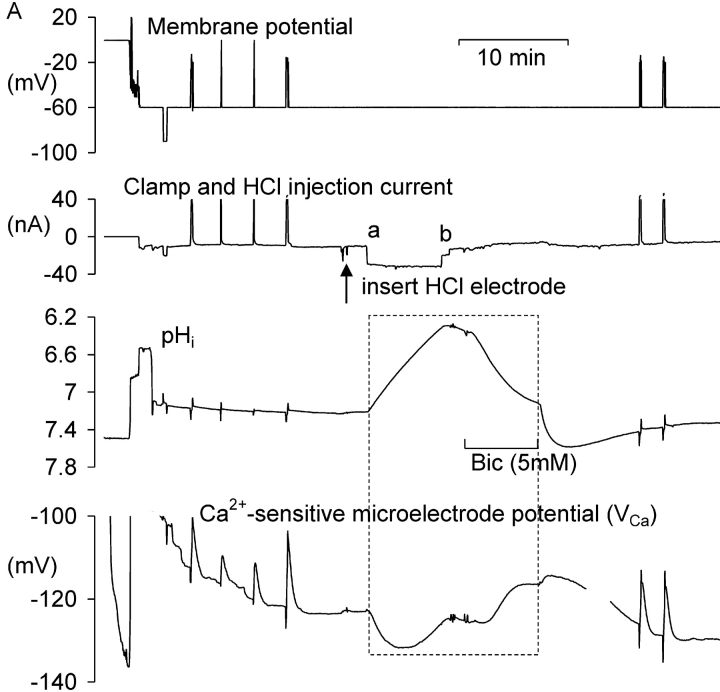
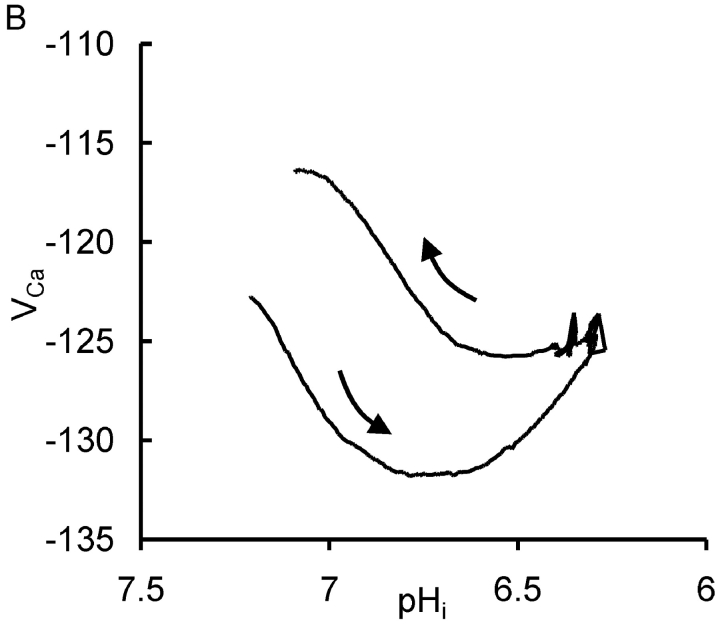
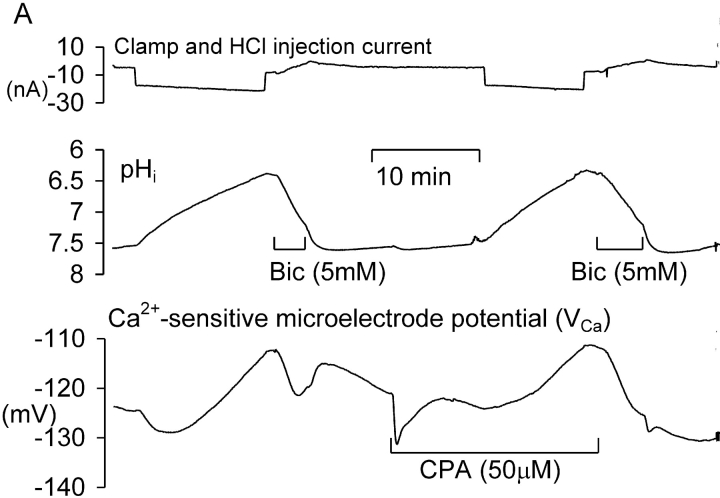
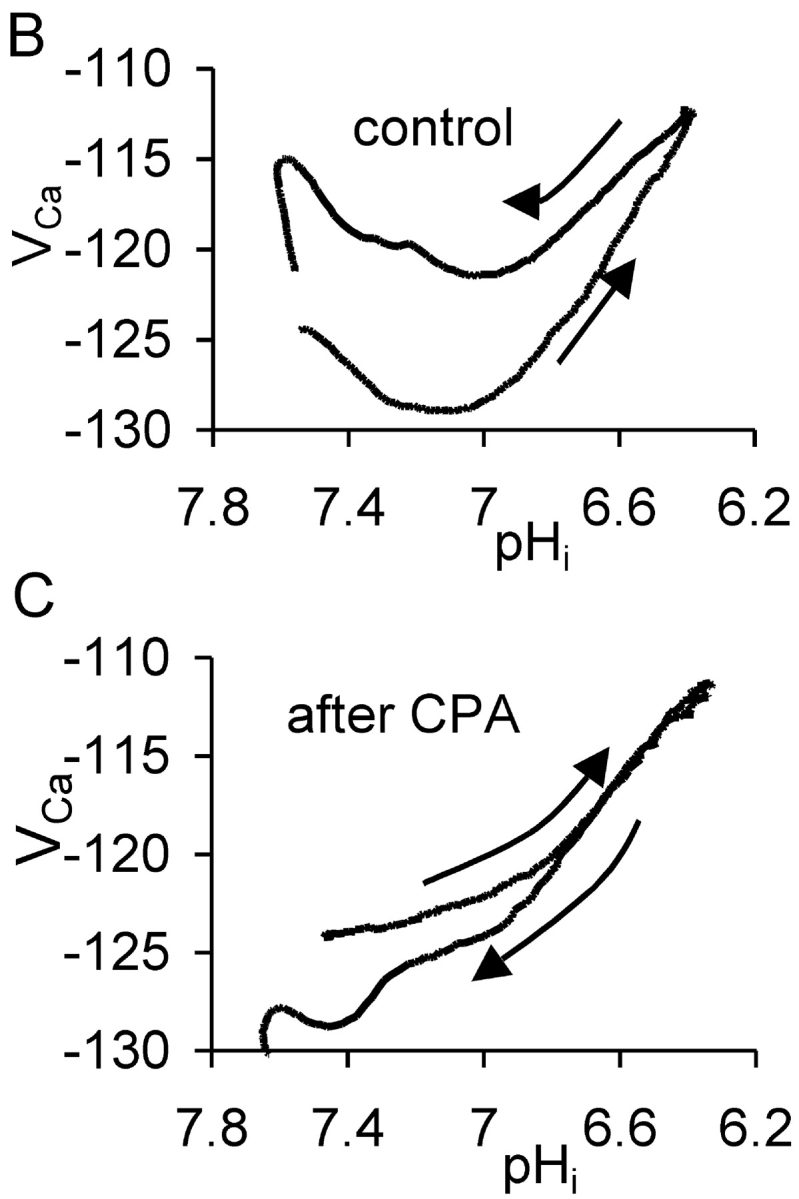
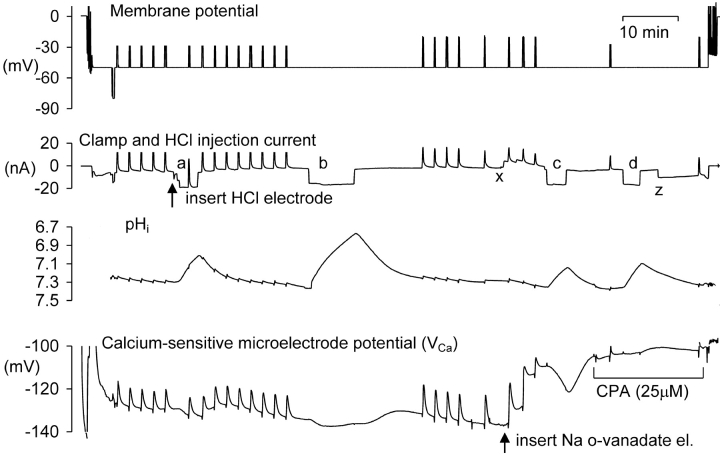
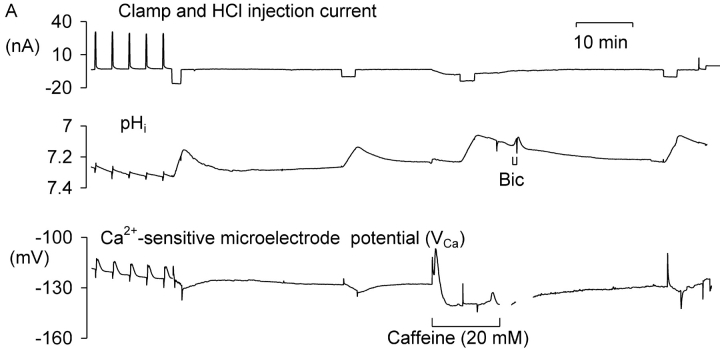
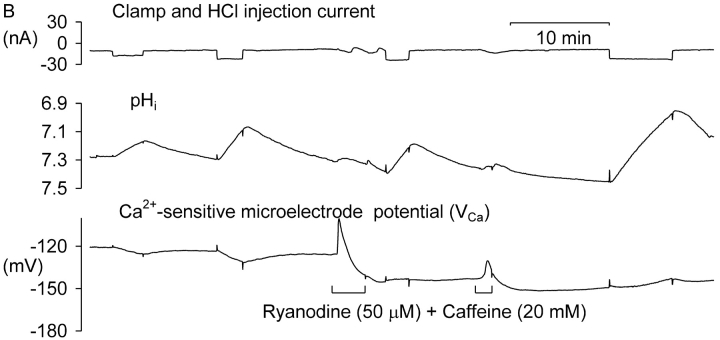
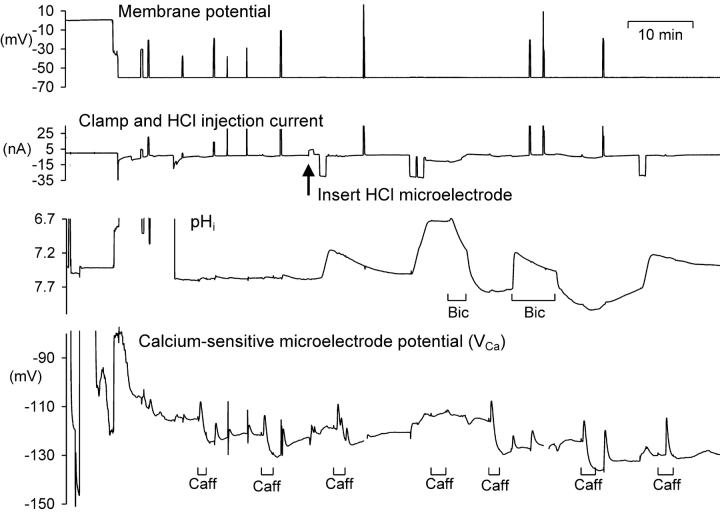
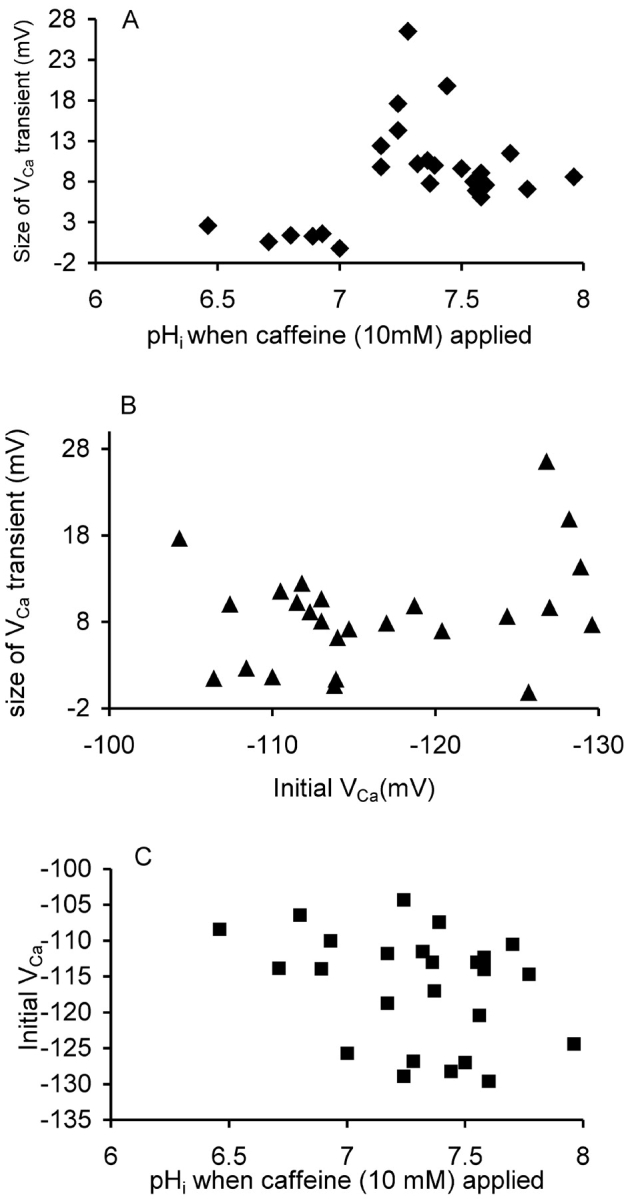
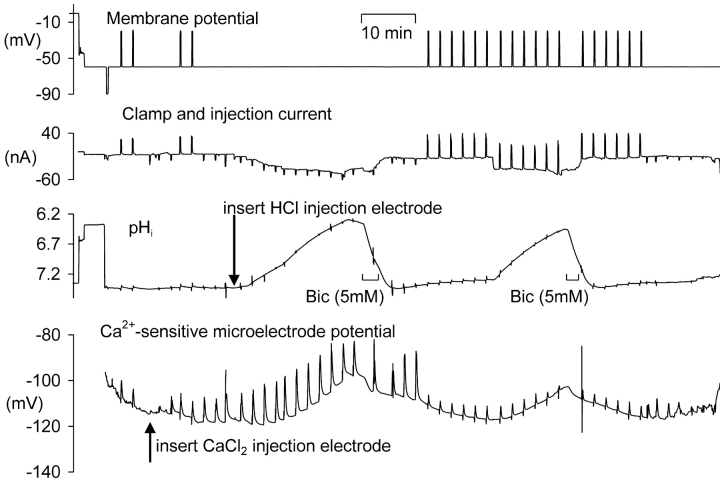
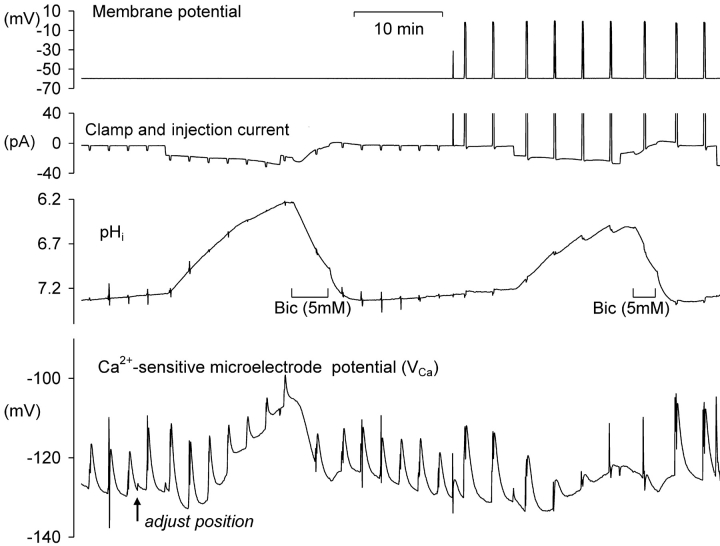
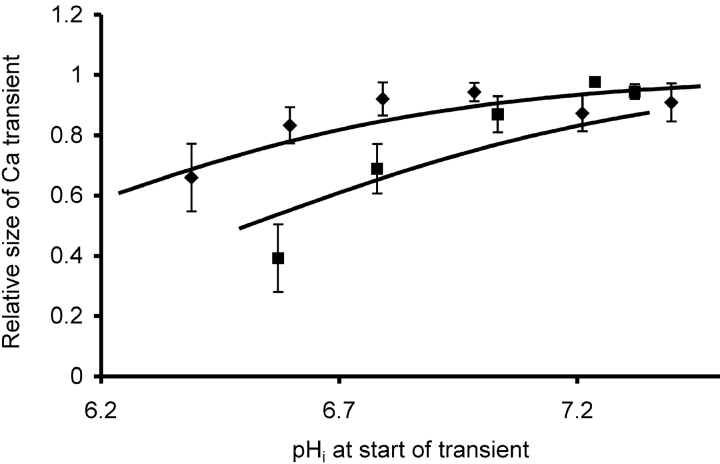
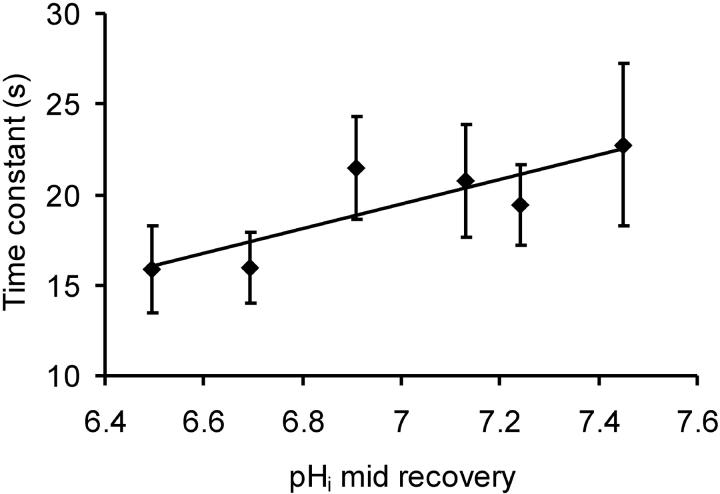
To investigate the mechanisms by which low intracellular pH influences calcium signaling, I have injected HCl, and in some experiments CaCl(2), into snail neurons while recording intracellular pH (pH(i)) and calcium concentration ([Ca(2+)](i)) with ion-sensitive microelectrodes. Unlike fluorescent indicators, these do not increase buffering. Slow injections of HCl (changing pH(i) by 0.1-0.2 pH units min(-1)) first decreased [Ca(2+)](i) while pH(i) was still close to normal, but then increased [Ca(2+)](i) when pH(i) fell below 6.8-7. As pH(i) recovered after such an injection, [Ca(2+)](i) started to fall but then increased transiently before returning to its preinjection level. Both the acid-induced decrease and the recovery-induced increase in [Ca(2+)](i) were abolished by cyclopiazonic acid, which empties calcium stores. Caffeine with or without ryanodine lowered [Ca(2+)](i) and converted the acid-induced fall in [Ca(2+)](i) to an increase. Injection of ortho-vanadate increased steady-state [Ca(2+)](i) and its response to acidification, which was again blocked by CPA. The normal initial response to 10 mM caffeine, a transient increase in [Ca(2+)](i), did not occur with pH(i) below 7.1. When HCl was injected during a series of short CaCl(2) injections, the [Ca(2+)](i) transients (recorded as changes in the potential (V(Ca)) of the Ca(2+)-sensitive microelectrode), were reduced by only 20% for a 1 pH unit acidification, as was the rate of recovery after each injection. Calcium transients induced by brief depolarizations, however, were reduced by 60% by a similar acidification. These results suggest that low pH(i) has little effect on the plasma membrane calcium pump (PMCA) but important effects on the calcium stores, including blocking their response to caffeine. Acidosis inhibits spontaneous calcium release via the RYR, and leads to increased store content which is unloaded when pH(i) returns to normal. Spontaneous release is enhanced by the rise in [Ca(2+)](i) caused by inhibiting the PMCA.


Figures

F<sc>igure</sc> 1.
Figure 1.
The effect of HCl injection on pHi and steady-state [Ca2+]i in a voltage-clamped snail neuron. (A) Record of membrane potential, clamp and HCl injection current, pHi and VCa, during a short experiment. VCa values of −100, −120, and 140 mV correspond, respectively, to [Ca2+]i values of 1.7 μM, 300 nM, and 60 nM. The Ca2+-sensitive microelectrode was inserted first, then the membrane potential and clamp electrodes (both filled with KCl, the latter pushed against the cell membrane before being zapped in by switching on the clamp) and then the pH-sensitive microelectrode. The membrane potential was clamped at −60 mV except for one brief hyperpolarization and six brief depolarizations. After the first four depolarizations the HCl electrode was inserted (arrow) and used to lower pHi to ∼6.3. The injection current, shown as a downward deflection between a and b on the current trace, was then switched off and pHi allowed to start recovering. 3 min after the injection current was switched off a solution with 5 mM bicarbonate was superfused (shown as bar under pHi record) for 7 min to accelerate pHi recovery. (B) Graph of VCa versus pHi for the period (shown as within dashed box on Fig. 1 A) from the start of the HCl injection to the end of the bicarbonate superfusion. Arrows show direction in which time passed.
F<sc>igure</sc> 2.
Figure 2.
The effect of cyclopiazonic acid on the VCa response to acid injection. (A) Experiment showing two periods of acid injection (downward deflections of the current trace) before and after the start of application of 50 μM CPA. The membrane potential was held at −60 mV throughout the period displayed. (B) Plots of VCa versus pHi for the first period during which acid was injected and then pHi allowed to recover to the point where CPA was added. Arrows show direction of time. (C) Graph of VCa versus pHi for the second period, after the start of CPA application, during which acid was injected and pHi recovered. Passage of time again shown by arrows.
F<sc>igure</sc> 3.
Figure 3.
The effect of Ca-ATPase inhibitors on the response of VCa to acid injections. Records of membrane potential, clamp, and injection current, pHi and VCa, during a complete experiment. The membrane potential was clamped at −50 mV except for one brief hyperpolarization and many brief depolarizations to test homeostatic mechanisms. After the first five depolarizations the HCl electrode was inserted and current passed through it to lower pHi four times, as shown by the downward current deflections (a–d). When pHi had recovered from the second HCl injection, o-vanadate was injected between points x and z to inhibit the PMCA. In this experiment pHi was allowed to recover after each injection without bicarbonate superfusion.
F<sc>igure</sc> 4.
Figure 4.
The effect of caffeine alone and with ryanodine on the response of VCa to HCl injection. (A) The cell was clamped at −60 mV except at the start of the section shown, when five depolarizations to −20 mV for 10 s were applied. Then HCl was injected for two short periods, and when pHi had recovered, caffeine was superfused for 12 min. During caffeine superfusion a third HCl injection was made, and near the end of the experiment, a fourth. The two missing parts of the VCa trace after caffeine washout are due to removal of noise from the clamp electrode. (B) Another cell, which was clamped at −60 mV throughout. After two acid injections, a freshly-made solution of ryanodine and caffeine was superfused for 3 min. Then another HCl injection was made. A second application of ryanodine and caffeine showed that the first had not been completely effective. A second postryanodine injection again caused no decrease in [Ca2+]i.
F<sc>igure</sc> 5.
Figure 5.
The effect of low pHi on the response of VCa to the application of 10 mM caffeine. The first half of a long experiment is shown, including the period during which the calcium-sensitive microelectrode was pushed right through the cell and then withdrawn back into the cell. After two applications of 10 mM caffeine, an HCl microelectrode was inserted through which currents were passed to decrease pHi, shown as downward deflections on the current record. Caffeine was applied as shown by the bars below the VCa record, and bicarbonate (5 mM) was applied for two periods as indicated.
F<sc>igure</sc> 6.
Figure 6.
Caffeine-induced calcium release at different pHi. (A) The size of the transient change in VCa occurring within 60 s of the start of 25 applications of 10 mM caffeine onto three different cells is plotted against the pHi at the time of application. (B) The size of the transient change in VCa plotted against the VCa at the time of application. (C) The initial VCa and pHi when the caffeine applications were made. Data from three experiments in which caffeine was applied a total of 25 times.
F<sc>igure</sc> 7.
Figure 7.
The effect of HCl injection on pHi and on VCa transients generated either by injection of CaCl2 or by depolarizations to −20 mV for 10 s. The membrane potential was clamped at −60 mV except for brief depolarizations. After the first two depolarizations the CaCl2 electrode was inserted and used to make several injections. Finally the HCl electrode was inserted and used to reduce pHi. Downward offsets on the current trace indicate the periods during which Ca2+ or H+ and Cl ions were injected iontophoretically, and upward deflections indicate depolarizations. After the two periods when pHi was reduced by HCl injection, recovery was assisted by superfusion of Ringer containing 5 mM added bicarbonate. The large vertical excursions of the pH and calcium traces were caused by electrical pickup by the amplifier inputs.
F<sc>igure</sc> 8.
Figure 8.
The effect of HCl injection on pHi and on VCa transients generated either by injection (downward deflections on the current record) of CaCl2 or by depolarizations to 0 mV for 10 s (upward deflections on the current record). After the first three injections, the position of the calcium-sensitive microelectrode was adjusted; this increased the recorded VCa transients. After the two periods when pHi was reduced by HCl injection, recovery was assisted by superfusion of Ringer containing 5 mM added NaHCO3. The vertical excursions of the pH and calcium traces were caused by electrical pickup by the amplifier inputs.
F<sc>igure</sc> 9.
Figure 9.
Effect of low pHi on the size of the transient increases in VCa induced by either iontophoretic injections (♦) or 10 s depolarizations (▪). The calcium transients from each period of acid injection were normalized relative to the largest transient in that series, then collected in 0.2 pH unit bins (the pH at the start of each injection). The mean transient size and SEM for each bin was plotted against the average starting pHi for the transients in each bin. Data from five different experiments, with a total of 26 injections and 25 depolarizations. Lines are least squares best fits to the original normalized data of the following relationship: pHst = pK + log (ΔCa/1 − ΔCa), where pHst is the pHi at the start of a VCa transient, pK the pH when ΔCa = 0.5, and ΔCa the relative size of the calcium transient. The pKs giving the two lines were 6.05 for the injections and 6.51 for the depolarizations.
F<sc>igure</sc> 10.
Figure 10.
The effect of low pHi on the rate of recovery of [Ca2+]i (expressed as VCa) for calcium injections from three experiments, those of Figs. 6 and 7 and another. Transients were grouped into 0.2 pH unit bins (pHi at the midpoint of the recovery), and averaged with respect to both pHi and time constant. The bars show the standard errors of the mean time constants.

Similar articles

Cited by

References

    1. Ahmed, Z., and J.A. Connor. 1980. Intracellular pH changes induced by calcium influx during electrical activity in molluscan neurons. J. Gen. Physiol. 75:403–426. - PMC - PubMed
    1. Ammann, D., T. Bührer, U. Schefer, M. Müller, and W. Simon. 1987. Intracellular neutral carrier-based Ca2+ microelectrode with subnanomolar detection limit. Pflugers Arch. 409:223–228. - PubMed
    1. Ballanyi, K., and K. Kaila. 1998. Activity-evoked changes in intracellular pH. pH and Brain Function. K. Kaila and B.R. Ransom, editors. Wiley-Liss, New York. 291–308.
    1. Balnave, C.D., and R.D. Vaughn-Jones. 2000. Effect of intracellular pH on spontaneous Ca2+ sparks in rat ventricular myocytes. J. Physiol. 528:25–37. - PMC - PubMed
    1. Benham, C.D., M.L. Evans, and C.J. McBain. 1992. Ca2+ efflux mechanisms following depolarization evoked calcium transients in cultured rat sensory neurones. J. Physiol. 455:567–583. - PMC - PubMed

Publication types