. 2002 Sep 30;158(7):1251-62.
doi: 10.1083/jcb.200204010.

Selective internalization of sodium channels in rat dorsal root ganglion neurons infected with herpes simplex virus-1

Affiliations

Selective internalization of sodium channels in rat dorsal root ganglion neurons infected with herpes simplex virus-1

Nina Storey et al. J Cell Biol. .

Erratum in

  • J Cell Biol. 2002 Nov;159(4):707.

Abstract

The neurotropic virus, herpes simplex type 1 (HSV-1), inhibits the excitability of peripheral mammalian neurons, but the molecular mechanism of this effect has not been identified. Here, we use voltage-clamp measurement of ionic currents and an antibody against sodium channels to show that loss of excitability results from the selective, precipitous, and complete internalization of voltage-activated sodium channel proteins from the plasma membrane of neurons dissociated from rat dorsal root ganglion. The internalization process requires viral protein synthesis but not viral encapsulation, and does not alter the density of voltage-activated calcium or potassium channels. However, internalization is blocked completely when viruses lack the neurovirulence factor, infected cell protein 34.5, or when endocytosis is inhibited with bafilomycin A(1) or chloroquine. Although it has been recognized for many years that viruses cause cell pathology by interfering with signal transduction pathways, this is the first example of viral pathology resulting from selective internalization of an integral membrane protein. In studying the HSV-induced redistribution of sodium channels, we have uncovered a previously unknown pathway for the rapid and dynamic control of excitability in sensory neurons by internalization of sodium channels.


Figures
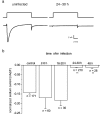
Figure 1.
Figure 1.
Sodium currents from HSV-1–infected and uninfected DRG neurons. (a) Sodium currents evoked by a voltage step from −80 to 10 mV in control, uninfected DRG neurons and 24 h after infection with HSV-1. (b) Temporal effects of HSV-1 infection on normalized sodium currents in DRG neurons. Adult rat DRG neurons were infected with 5 plaque-forming units HSV-1/DRG neuron in vitro. At intervals during HSV-1 infection, sodium currents were recorded and normalized for cell capacitance. The mean-normalized sodium current ± SEM is plotted against time after infection. DRG neurons infected with HSV-1 for 24–30 or 48 h had significantly smaller normalized currents than neurons infected for less time (Kruskal-Wallis statistical test followed by the Kolmogorov-Smirnov pairwise comparison; P < 0.0001).
Figure 2.
Figure 2.
TTX-S and TTX-R sodium currents of uninfected and HSV-1–infected DRG neurons. (a) The total sodium current (INa) was evoked after a prepulse to −120 mV with a voltage step to −20 mV. The TTX-R sodium current was evoked after a prepulse to −50 mV also with a voltage step to −20 mV. The TTX-S trace was obtained by subtraction. (b) The normalized mean sodium current ± SEM from neurons with a measurable current (nA/pF). The remaining TTX-S and TTX-R sodium currents of infected neurons were significantly smaller than the TTX-S and TTX-R sodium currents of control cells (P < 0.05 t test). (c) Averaged mean normalized sodium current ± SEM plotted against command potential for control (•; n = 16) and HSV-1–infected neurons (▪; n = 13). (d) Representative normalized TTX-S (▪) and TTX-R (•) sodium currents plotted against command potential from a neuron infected for 24 h (open) and an uninfected neuron (filled).
Figure 3.
Figure 3.
Effect of HSV-1 infection on calcium currents in DRG neurons. (a) Leak-subtracted raw traces illustrating the separation of LVA and HVA calcium channel currents. (b) The mean-normalized peak HVA and LVA calcium current ± SEM of uninfected or DRG neurons infected with HSV-1 for 24 h. The HVA- and LVA-type calcium currents did not differ significantly between the uninfected and the infected neurons (t test, P > 0.3). (c) Two families of calcium channel currents evoked by a range of command potentials between −80 and 40 mV from an uninfected and infected neuron. The current traces were leak current–subtracted. (d) The graph shows the mean-normalized conductance ± SEM from control (•; n = 36) and infected (▪; n = 27) neurons and the normalized calcium currents ± SEM plotted against prepulse potentials from control (○; n = 9) and infected (□; n = 8) neurons. The continuous lines were obtained by fitting Boltzmann functions to the mean-normalized data.
Figure 4.
Figure 4.
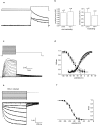
Effect of HSV-1 infection on potassium currents of DRG neurons. (a) Inactivating and noninactivating delayed rectifier type potassium currents from an uninfected DRG neuron (leak subtracted). The total potassium currents were evoked from −80 mV with a step potential to +10 mV, and the noninactivating potassium currents were evoked after a prepulse to −50 mV from a test potential of +10 mV. The inactivating potassium current could be separated by subtraction (dashed line). (b) The normalized mean noninactivating and inactivating type potassium current amplitude ± SEM is shown for control and infected neurons. There was no significant difference between the normalized potassium current amplitudes of uninfected or HSV-1–infected neurons (t test, P > 0.3). (c) A family of outward potassium currents in neurons. Neurons were held at −80 mV. The activation protocol consisted of a series of 15-ms depolarizing voltage steps between −90 and +40 mV. Note the outward tail currents that occur when the membrane is stepped back to −40 mV. (d) The activation and steady-state inactivation curves of uninfected and HSV-1–infected neurons. The graph shows the normalized mean conductance ± SEM plotted against the command potential. The activation and steady-state inactivation curves of control (•; n = 25) and infected (▪; n = 11) neurons are shown. The curves are obtained by fitting the data points with Boltzmann functions. (e) A family of inwardly rectifying potassium currents were evoked from an HSV-1–infected neuron by a range of 900-ms potentials between −50 and −140 mV, and from a holding potential of −70 mV. (f) The graph shows the mean-normalized sustained current amplitude ± SEM of uninfected (•) or infected (▪) DRG neurons. There was no significant difference between the normalized current amplitudes (t test, P > 0.1).
Figure 5.
Figure 5.
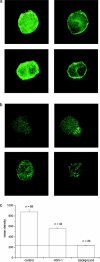
The distribution of sodium channels in HSV-1–infected and uninfected DRG neurons. (a) The left panel is the collapsed image of several serial scans showing the total neuron distribution of sodium channel α subunits of uninfected neurons, and the right panel is a single z-axis image showing the cross section of an uninfected neuron demonstrating plasma membrane staining. (b) The left panel is the collapsed image of several serial scans showing the total neuron distribution of sodium channel α subunits of an HSV-1–infected neuron, and the right panel is a single z-axis image showing the cross section of the infected neurons. (c) The mean fluorescence intensity of stained HSV-1–infected and uninfected neurons. The mean intensity of fluorescence was significantly reduced in infected neurons (t test, P < 0.00001).
Figure 6.
Figure 6.
The effect of internalization inhibitors on sodium currents in uninfected and HSV-1–infected DRG neurons. (a) Sodium current traces from HSV-1–infected and uninfected neurons treated with bafilomycin A1 contrasts with the lack of current in an HSV-1– infected neuron. (b) The mean-normalized current amplitude ± SEM of uninfected and infected neurons treated with the inhibitors of internalization, 1 μM bafilomycin A1 or 100 μM chloroquine. The current amplitudes of infected or uninfected neurons treated with internalization inhibitors did not differ significantly from each other (P > 0.5). However, all were significantly larger than the current amplitudes of infected neurons (P > 0.0001). Statistical differences were examined by the Kruskal-Wallis statistical test followed by the Kolmogorov-Smirnov pairwise comparison.
Figure 7.
Figure 7.
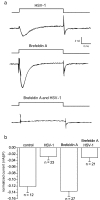
The effect of trans-Golgi network collapse on normalized sodium current amplitude of control and HSV-1–infected DRG neurons. (a) Sodium currents of DRG neurons either treated with brefeldin A and/or infected with wt HSV-1. (b) Mean-normalized sodium current amplitude ± SEM for HSV-1–infected and uninfected DRG neurons with or without brefeldin A. Treatment with brefeldin A did not significantly alter the amplitude of sodium currents in infected or uninfected neurons. The normalized amplitudes of brefeldin A–treated HSV-1 infected and HSV-1–infected DRG neurons were both significantly smaller than the amplitudes of brefeldin A–treated or untreated control DRG neurons (Kruskal-Wallis test followed by the Kolmogorov-Smirnov pairwise comparison; P < 0.001). 70% of wt HSV-1–infected DRG neurons had no sodium current, whereas 71% of cells infected with wt HSV-1 and treated with brefeldin A had no sodium current.
Figure 8.
Figure 8.
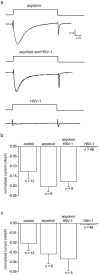
The effect of acyclovir on sodium currents of HSV-1–infected and uninfected DRG neurons. (a) Sodium currents in neurons treated with acyclovir and/or HSV-1 infected. The effect of acyclovir on TTX-S– and TTX-R–normalized (b and c, respectively) sodium current amplitudes. The normalized sodium currents in HSV-1–infected neurons were significantly smaller than those in infected neurons treated with acyclovir (Kruskal-Wallis statistical test followed by the Kolmogorov-Smirnov pairwise comparison; P < 0.0005).
Figure 9.
Figure 9.
TTX-S and TTX-R sodium currents in DRG neurons infected with HSV lacking ICP 34.5. Graphs a and c show the mean-normalized TTX-S and TTX-R sodium current amplitudes ± SEM of uninfected neurons or neurons infected with HSV lacking ICP 34.5. There was no significant difference in the normalized current amplitude (analysis of variance followed by Tukey's post hoc analysis; P > 0.4). Graphs b and d show the mean-normalized conductance ± SEM from uninfected neurons (○; n = 8) and neurons infected with HSV lacking ICP 34.5 (□; n = 5). The continuous lines were obtained by fitting Boltzmann functions to the mean-normalized data.

Similar articles

Cited by

References

    1. Andoh, T., K. Shiraki, M. Kurokawa, and Y. Kuraishi. 1995. Paresthesia induced by cutaneous infection with herpes simplex virus in rats. Neurosci Lett. 190:101–104. - PubMed
    1. Abriel, H., E., Kamynina, J.D. Horisberger, and O. Staub. 2000. Regulation of the cardiac voltage-gated Na+ channel (H1) by the ubiquitin-protein ligase Nedd4. FEBS Lett. 446:377–380. - PubMed
    1. Bevan, S., and N. Storey. 2002. Modulation of sodium channels in primary afferent neurons. Novartis Found. Symp. 241:144–153. - PubMed
    1. Bevan, S., and J. Winter. 1995. Nerve growth factor (NGF) differentially regulates the chemosensitivity of adult rat cultured sensory neurons. J. Neurosci. 15:4918–4926. - PMC - PubMed
    1. Bowman, E.J., A. Siebers, and K. Altendorf. 1988. Bafilomycins: a class of inhibitors of membrane ATPases from microorganisms, animal cells, and plant cells. Proc. Natl. Acad. Sci. USA. 85:7972–7976. - PMC - PubMed

Publication types

MeSH terms