. 2002 Oct 1;30(19):4250-63.
doi: 10.1093/nar/gkf540.

RNA canonical and non-canonical base pairing types: a recognition method and complete repertoire

Affiliations

RNA canonical and non-canonical base pairing types: a recognition method and complete repertoire

Sébastien Lemieux et al. Nucleic Acids Res. .

Abstract

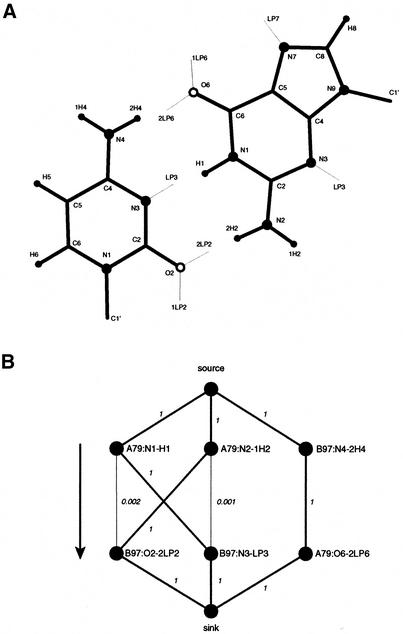
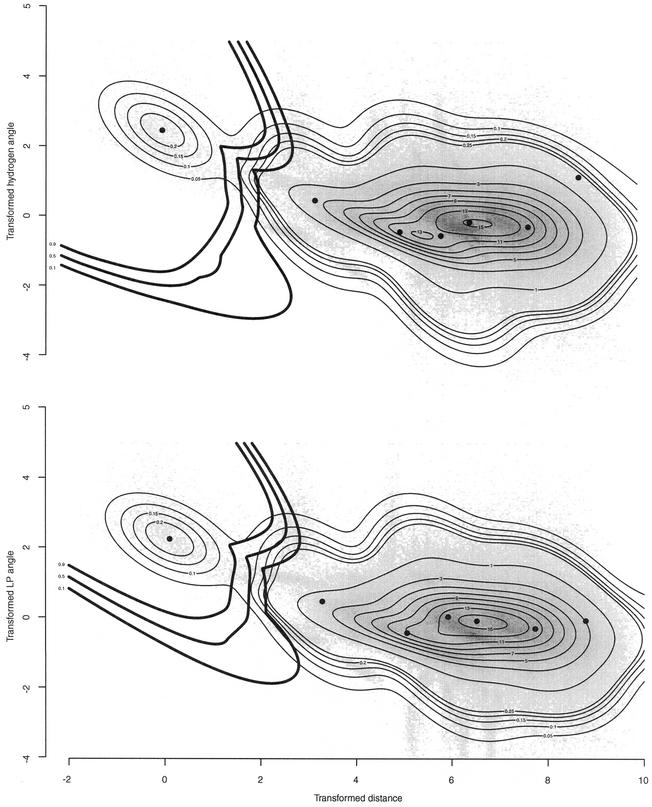
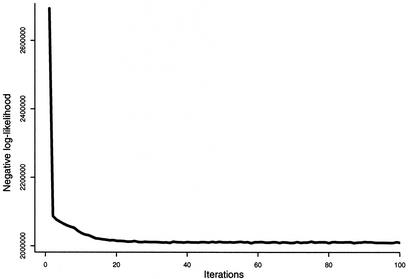
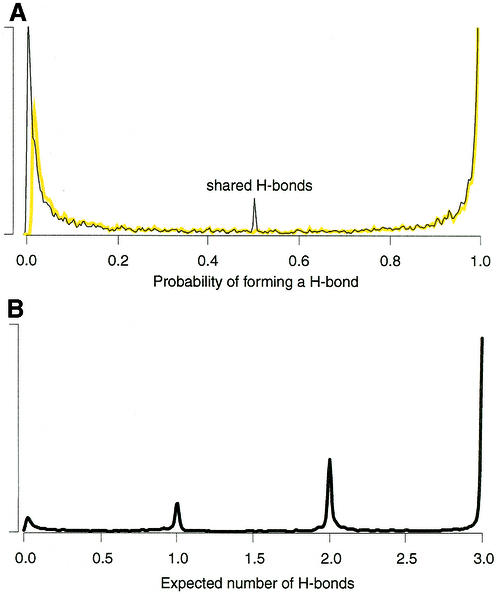
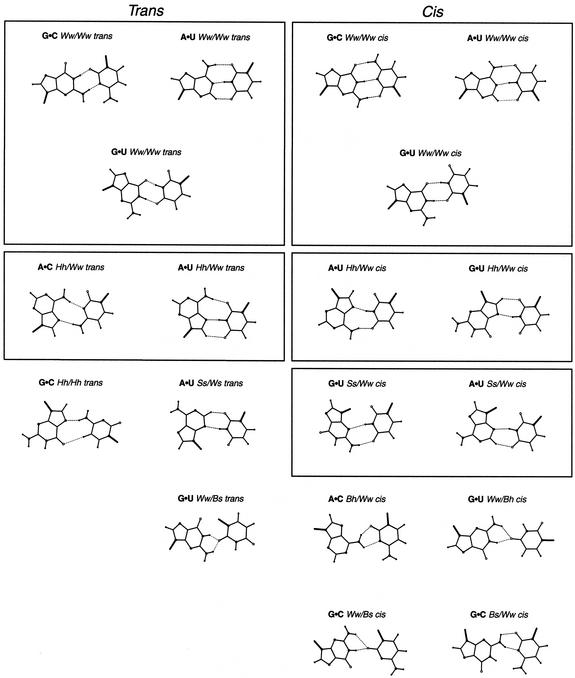
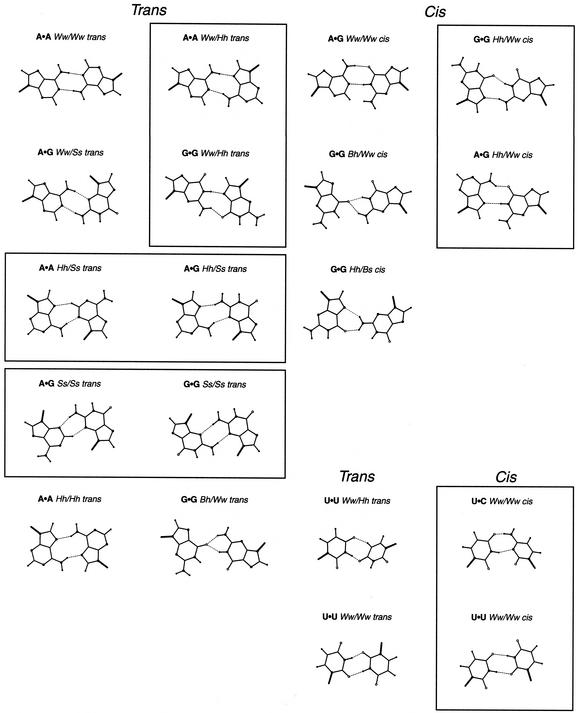
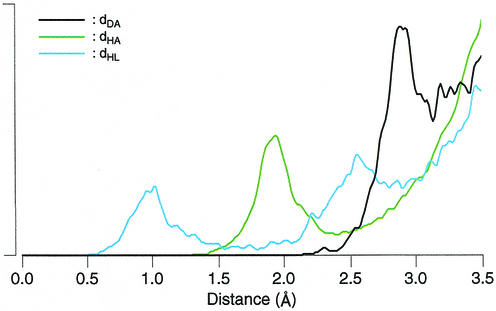
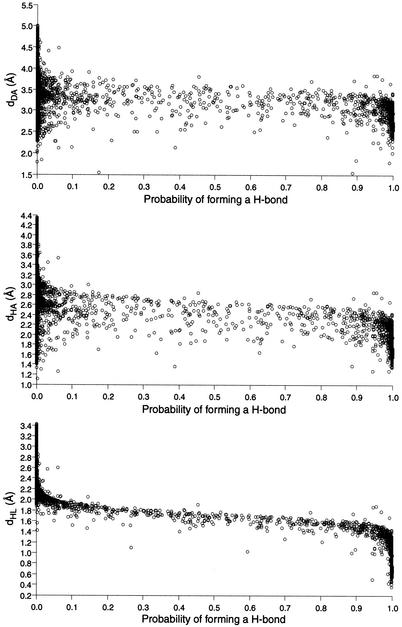
The problem of systematic and objective identification of canonical and non-canonical base pairs in RNA three-dimensional (3D) structures was studied. A probabilistic approach was applied, and an algorithm and its implementation in a computer program that detects and analyzes all the base pairs contained in RNA 3D structures were developed. The algorithm objectively distinguishes among canonical and non-canonical base pairing types formed by three, two and one hydrogen bonds (H-bonds), as well as those containing bifurcated and C-H.X...H-bonds. The nodes of a bipartite graph are used to encode the donor and acceptor atoms of a 3D structure. The capacities of the edges correspond to probabilities computed from the geometry of the donor and acceptor groups to form H-bonds. The maximum flow from donors to acceptors directly identifies base pairs and their types. A complete repertoire of base pairing types was built from the detected H-bonds of all X-ray crystal structures of a resolution of 3.0 A or better, including the large and small ribosomal subunits. The base pairing types are labeled using an extension of the nomenclature recently introduced by Leontis and Westhof. The probabilistic method was implemented in MC-Annotate, an RNA structure analysis computer program used to determine the base pairing parameters of the 3D modeling system MC-Sym.


Figures

Figure 1
Figure 1
A base pairing and associated graph. (A) A canonical G·C Watson–Crick base pair extracted from positions A79 and B97 of the loop E motif from E.coli 5S rRNA (PDB no. 354D). The thin lines indicate the direction of LP, named using the same convention as for the hydrogen atoms. (B) Corresponding graph showing the probabilities associated with this base pair (see Table 2 for the actual measurements and probabilities). The donor groups are located in the upper row of nodes, and the acceptor groups in the bottom row. The arrow shows the direction of the flow from the source to the sink. The capacities are indicated beside each edge (only edges with capacity >10–4 are shown). The thin lines show the edges with no flow after the optimization of the maximum flow. The thick lines between acceptor and donor groups correspond to the selected H-bonds.
Figure 2
Figure 2
H-bond parameters. The putative H-bond shown is a weak C-H…O. The hydrogen and LP angles are identified by α and β, respectively, and the distance between the hydrogen and LP is indicated by d. Nitrogen and hydrogen atoms are shown by large and small filled circles, respectively. Oxygen atoms are shown by open circles. Thin lines are used to indicate the direction of the LP.
Figure 3
Figure 3
Base pairing type examples. These were found in only one structure of HR-RNA-SET. (A) The C·G Ww/Ss trans base pair found at positions ‘9’26:‘9’22 and ‘9’46:‘9’43 in 1FFK. (B) The G·G Hh/Bs trans base pair found at position A260:A265 in 1FJG. (C) The A·C Ww/Bh cis base pair found at position 38:32 in 1YFG. (D) The U·A Ws/Bh trans base pair found at positions ‘0’1116:‘0’1246, ‘0’1244:‘0’1118 and ‘0’2661:‘0’2812 in 1FFK. (E) The C·C Ww/Hh trans base pair found at position ‘0’1834:‘0’1841 in 1FFK. (F) The C·C Ww/Bh cis base pair found at position ‘0’937:‘0’1033 in 1FFK. The H-bonds are indicated by dotted lines. Empty, small filled and large filled circles are used for oxygen, hydrogen and nitrogen atoms, respectively
Figure 4
Figure 4
RNA base faces. Nitrogen atoms are shown by large black circles, hydrogen by small filled circles and oxygen atoms by open circles. The LP are shown with thin lines. The ribose moiety is shown by the letter R.
Figure 5
Figure 5
Superimposed two-dimensional projections of the data set histogram, modeled probability density and surface of decision. The histogram of the data set is shown in shades of grey. The modeled probability density is shown by thin isocontours. Between 0 and 0.25 they were plotted at each 0.05 interval, whereas between 1 and 15 they were plotted at each interval of 1. An integration was carried out on the axis of projection corresponding to the effect observed by the histogram. The surface of decision is shown with thick lines isocontoured at probabilities 0.1, 0.5 and 0.9. The maximum probability is returned on the axis of projection. The circles represent the optimized mean of the seven Gaussians.
Figure 6
Figure 6
Minimization of the negative log-likelihood for the mixture of seven unconstrained Gaussians on the transformed data set by the EM algorithm. The procedure was stopped after 100 steps, corresponding to 1 h of CPU time on a PIII-600.
Figure 7
Figure 7
Probability densities for xij, uij and the total flow of the base pairs. The probabilities were computed for all base pairs in HR-RNA-SET. Only those with a probability >10–4 are plotted. (A) The probability density for xij and uij are shown with a thin black line and yellow line, respectively. The center peak for xij (the optimized flow) is the result of bifurcated H-bonds. (B) The distribution of total flows obtained between every base pair in HR-RNA-SET. The total flow can be seen as the mathematical expectation of the number of H-bonds forming between two bases. The distribution clearly shows the discrete nature of this value. The area of each peak shows the relative proportion of one, two and three H-bond base pairs.
Figure 8
Figure 8
(Previous page and above) Two H-bond base pairing types found in HR-RNA-SET. Base pairing types that occur at least twice are shown. The 19 purine·pyrimidines base pairing types are on the opposite page. The 15 purine·purine base pairing types are on this page. The four pyrimidine·pyrimidine base pairing types are located at the bottom right corner of this page. Base pairing types were classified as either trans (left columns) or cis (right columns). Boxes are used to group isosteric base pairing types together.
Figure 8
Figure 8
(Previous page and above) Two H-bond base pairing types found in HR-RNA-SET. Base pairing types that occur at least twice are shown. The 19 purine·pyrimidines base pairing types are on the opposite page. The 15 purine·purine base pairing types are on this page. The four pyrimidine·pyrimidine base pairing types are located at the bottom right corner of this page. Base pairing types were classified as either trans (left columns) or cis (right columns). Boxes are used to group isosteric base pairing types together.
Figure 9
Figure 9
Distance-based parameters. The distributions are computed for all base pairs in HR-RNA-SET. The black line shows the distribution of distances between the donor and acceptor atoms, dDA. The yellow line shows the distribution of distances between the hydrogen and acceptor atoms, dHA. The blue line shows the distribution of distances between the hydrogen and LP, dHL.
Figure 10
Figure 10
Distance criteria versus probabilities of forming H-bonds. Each scatter plot shows the correlation between a distance criterion and the probabilities of forming H-bonds. Each dot represents the evaluation of a pair of donor and acceptor groups. The pairs separated by >5 Å were not considered.

References

    1. Ban N., Nissen,P., Hansen,J., Moore,P.B. and Steitz.T.A. (2000) The complete atomic structure of the large ribosomal subunit at 2.4 Å resolution. Science, 289, 905–920. - PubMed
    1. Wimberly B.T., Brodersen,D.E., Clemons,W.M.,Jr, Morgan-Warren,R.J., Carter,A.P., Vonrhein,C., Hartsch,T. and Ramakrishnan,V. (2000) Structure of the 30S ribosomal subunit. Nature, 407, 327–339. - PubMed
    1. Leontis N.B. and Westhof,E. (2001) Geometric nomenclature and classification of RNA base pairs. RNA, 7, 499–512. - PMC - PubMed
    1. Nagaswamy U., Voss,N., Zhang,Z. and Fox,G.E. (2000) Database of non-canonical base pairs found in known RNA structures. Nucleic Acids Res., 28, 375–376. - PMC - PubMed
    1. Lemieux S., Oldziej,S. and Major,F. (1998) Nucleic acids: qualitative modeling. In Allinger,N.L., Clark,T., Gasteiger,J., Kollman,P.A., Schaefer,H.F. and Schreiner,P.R. (eds), Encyclopedia of Computational Chemistry. John Wiley & Sons, West Sussex, UK.

Publication types