

Differential gene expression patterns in HER2/neu-positive and -negative breast cancer cell lines and tissues
- PMID: 12368191
- PMCID: PMC1867314
- DOI: 10.1016/S0002-9440(10)64394-5
Differential gene expression patterns in HER2/neu-positive and -negative breast cancer cell lines and tissues
Abstract
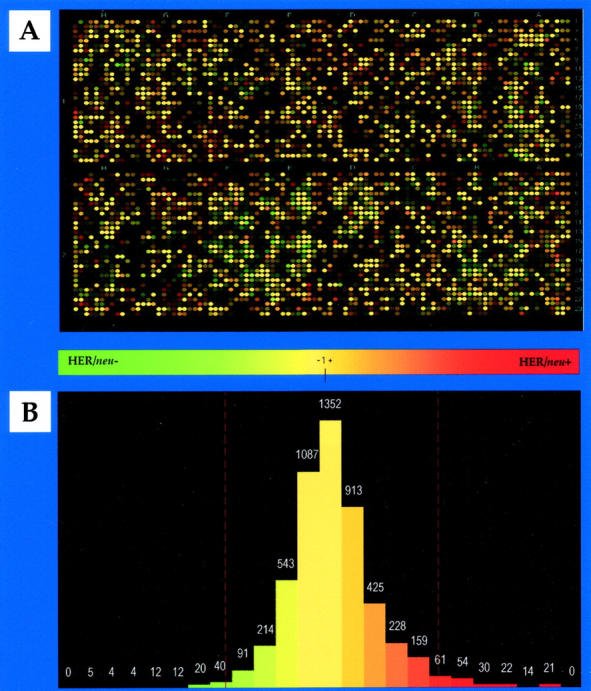
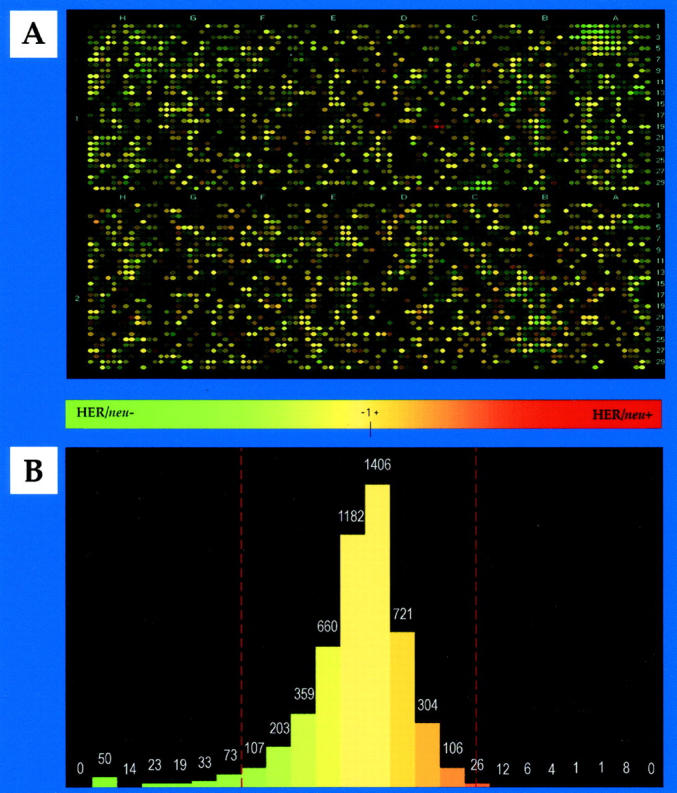
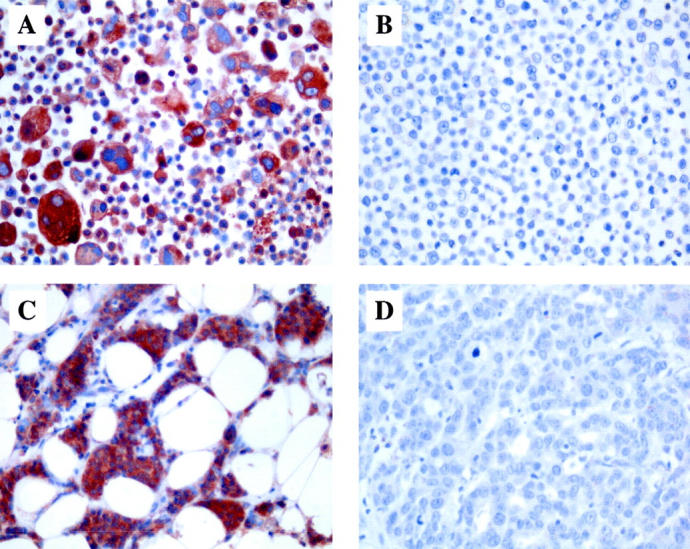
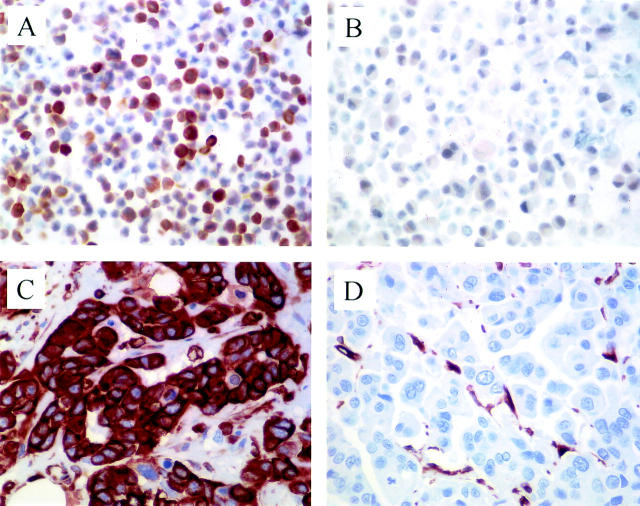
Overexpression of the oncogene HER2/neu (c-erbB-2) occurs in up to 30% of breast cancers and is correlated with reduced survival, especially in node-positive disease. The aim of this study was to identify genes associated with the aggressive phenotype of HER2/neu-positive breast cancer cells using cDNA microarrays. RNA was extracted from three HER2/neu-positive and three HER2/neu-negative breast cancer cell lines. Pooled RNA was hybridized in duplicate to the breast specific microarray filters from Research Genetics containing 5184 unique cDNAs. Subsequently, a similar comparison was performed for pooled RNAs from 10 node-positive, ER-positive invasive ductal carcinomas, half of which were HER2/neu overexpressers. In HER2/neu overexpressing breast cancer cell lines, 90 (1.7%) genes were up-regulated and 46 (0.9%) were down-regulated, compared to cell lines with low HER2/neu protein levels. In contrast, in HER2/neu overexpressing primary breast cancers, more genes were down-regulated (N = 132, 2.5%) than up-regulated (N = 19, 0.4%). Many of the differentially expressed genes have previously not been known to play a role in human neoplasia, and some of them may represent novel tumor suppressor or oncogenes. No genes were up-regulated, and only a small number of genes were down-regulated both in cell lines and in carcinomas with high HER2/neu protein levels. These included transforming acidic coiled-coil containing protein 1, glycogen phosphorylase BB, complement 1q and one EST. The differential expression of select genes was confirmed by Northern blotting (trefoil factor 3) or by immunocytochemistry (glycogen phosphorylase BB, vimentin, KAI1). In an extended validation study, 18 of 41 ER-negative, but none of 46 ER-positive, breast carcinomas were found to express vimentin, and all but one of the vimentin-positive tumors were confined to the HER2/neu-negative subgroup (P = 0.0019). Our findings support an important role of the mammary stroma in determining the clinical breast cancer phenotype.
Figures


Similar articles
-
Aberrant expression of novel and previously described cell membrane markers in human breast cancer cell lines and tumors.Clin Cancer Res. 2005 Jun 15;11(12):4357-64. doi: 10.1158/1078-0432.CCR-04-2107. Clin Cancer Res. 2005. PMID: 15958618
-
[Her2-Neu expression in ductal adenocarcinomas of the breast gland: correlation with histopathological parameters and estrogen receptors' expression in Mexican patients].Ginecol Obstet Mex. 2006 Oct;74(10):516-22. Ginecol Obstet Mex. 2006. PMID: 21961357 Spanish.
-
Moesin expression is associated with the estrogen receptor-negative breast cancer phenotype.Surgery. 1998 Aug;124(2):211-7. Surgery. 1998. PMID: 9706140
-
HER2/neu antisense targeting of human breast carcinoma.Oncogene. 2000 Dec 11;19(53):6138-43. doi: 10.1038/sj.onc.1204001. Oncogene. 2000. PMID: 11156527 Review.
-
Monitoring the circulating levels of the HER2/neu oncoprotein in breast cancer.Clin Breast Cancer. 2004 Jun;5(2):105-16. doi: 10.3816/cbc.2004.n.014. Clin Breast Cancer. 2004. PMID: 15245613 Review.
Cited by
-
Reduced Tumor Volume and Increased Necrosis of Human Breast Tumor Xenograft in Mice Pretreated by a Cocktail of Three Specific Anti-HER2 scFvs.Curr Protein Pept Sci. 2024;25(5):409-418. doi: 10.2174/0113892037269645231031095145. Curr Protein Pept Sci. 2024. PMID: 38018211
-
Trefoil factor family-3 is associated with aggressive behavior of colon cancer cells.Clin Exp Metastasis. 2005;22(2):157-65. doi: 10.1007/s10585-005-6615-z. Clin Exp Metastasis. 2005. PMID: 16086236
-
The impact of cysteine-rich intestinal protein 1 (CRIP1) in human breast cancer.Mol Cancer. 2013 Apr 9;12:28. doi: 10.1186/1476-4598-12-28. Mol Cancer. 2013. PMID: 23570421 Free PMC article.
-
Global analysis of HuR-regulated gene expression in colon cancer systems of reducing complexity.Gene Expr. 2004;12(1):49-59. doi: 10.3727/000000004783992215. Gene Expr. 2004. PMID: 15473260 Free PMC article.
-
The Emerging Role of Adhesion GPCRs in Cancer.ACS Pharmacol Transl Sci. 2020 Jan 13;3(1):29-42. doi: 10.1021/acsptsci.9b00093. eCollection 2020 Feb 14. ACS Pharmacol Transl Sci. 2020. PMID: 32259086 Free PMC article. Review.
References
-
- Pietras RJ, Arboleda J, Reese DM, Wongvipat N, Pegram MD, Ramos L, Gorman CM, Parker MG, Sliwkowski MX, Slamon DJ: HER-2 tyrosine kinase pathway targets estrogen receptor and promotes hormone-independent growth in human breast cancer cells. Oncogene 1995, 10:2435-2446 - PubMed
-
- Paik S, Hazan R, Fisher ER, Sass RE, Fisher B, Redmond C, Schlessinger J, Lippman ME, King CR: Pathologic findings from the national surgical adjuvant breast and bowel project: prognostic significance of erbB-2 protein overexpression in primary breast cancer. J Clin Oncol 1990, 8:103-112 - PubMed
-
- Alaoui-Jamali MA, Paterson J, Al Moustafa A-E, Yen L: The role of ErbB-2 tyrosine kinase receptor in cellular intrinsic chemoresistance: mechanisms and implications. Biochem Cell Biol 1997, 75:315-325 - PubMed
-
- Giunciuglio D, Culty M, Fassina G, Masiello L, Melchiori A, Paglialunga G, Arand G, Ciardiello F, Basolo F, Thompson EW: Invasive phenotype of MCF10A cells overexpressing c-Ha-ras and c-erbB-2 oncogenes. Int J Cancer 1995, 63:815-822 - PubMed
Publication types
MeSH terms
Substances
Grants and funding
LinkOut - more resources
Full Text Sources
Other Literature Sources
Medical
Molecular Biology Databases
Research Materials
Miscellaneous
