

Distinct and complementary information provided by use of tissue and DNA microarrays in the study of breast tumor markers
- PMID: 12368196
- PMCID: PMC3278769
- DOI: 10.1016/S0002-9440(10)64399-4
Distinct and complementary information provided by use of tissue and DNA microarrays in the study of breast tumor markers
Abstract
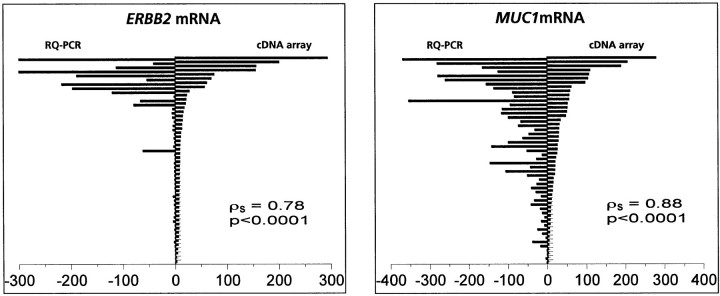
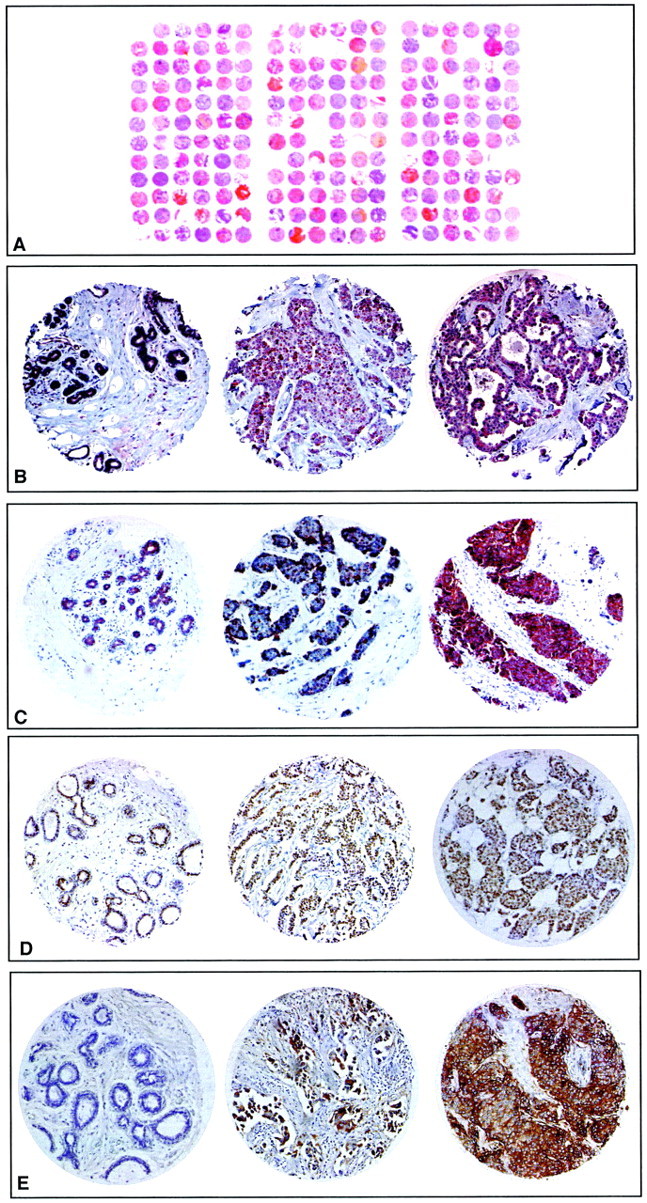
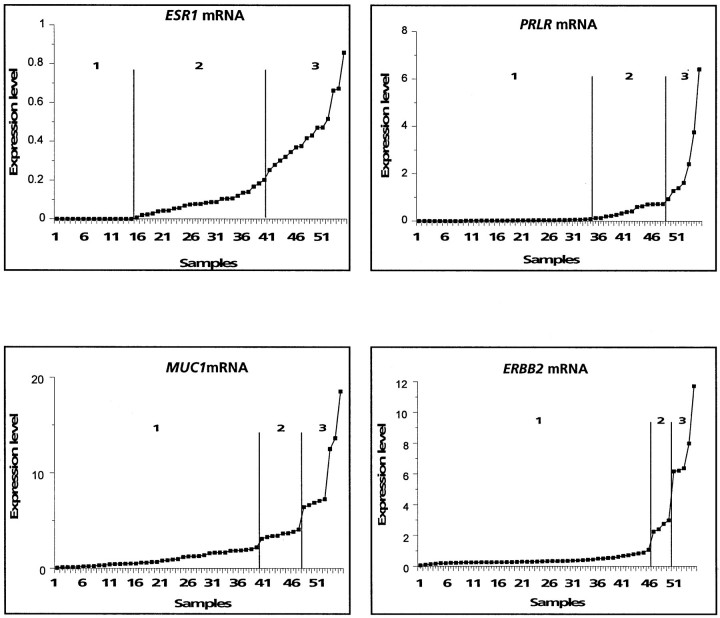
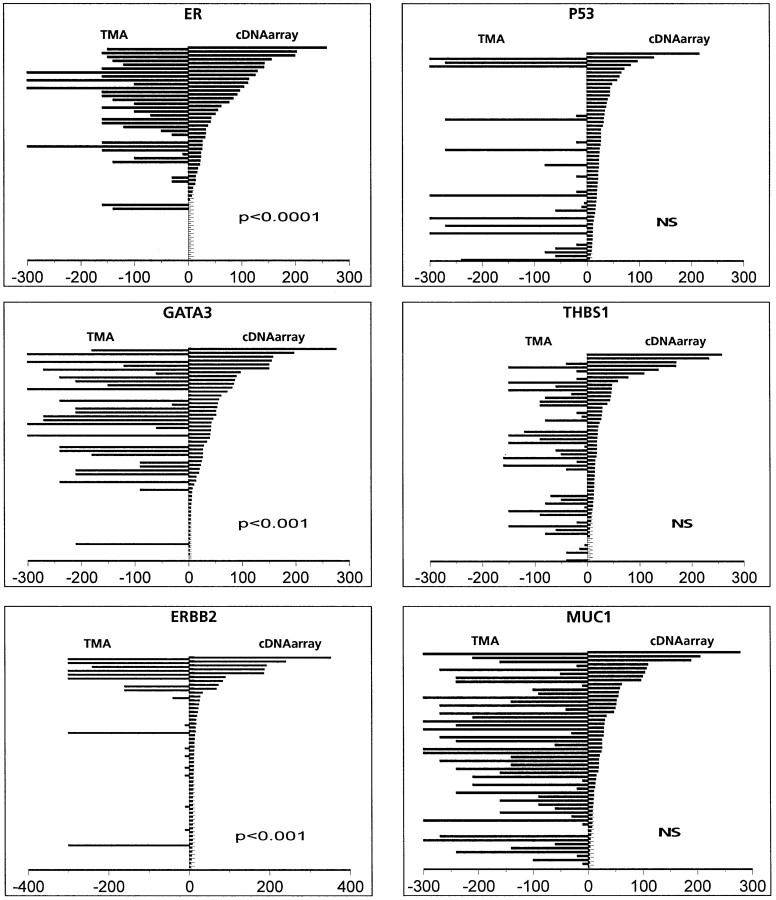
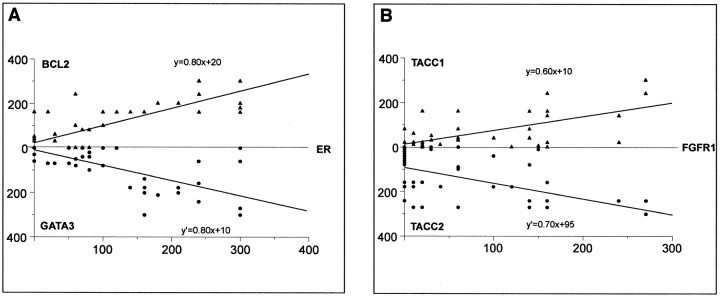
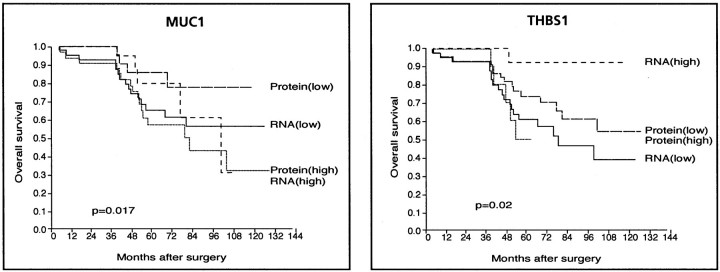
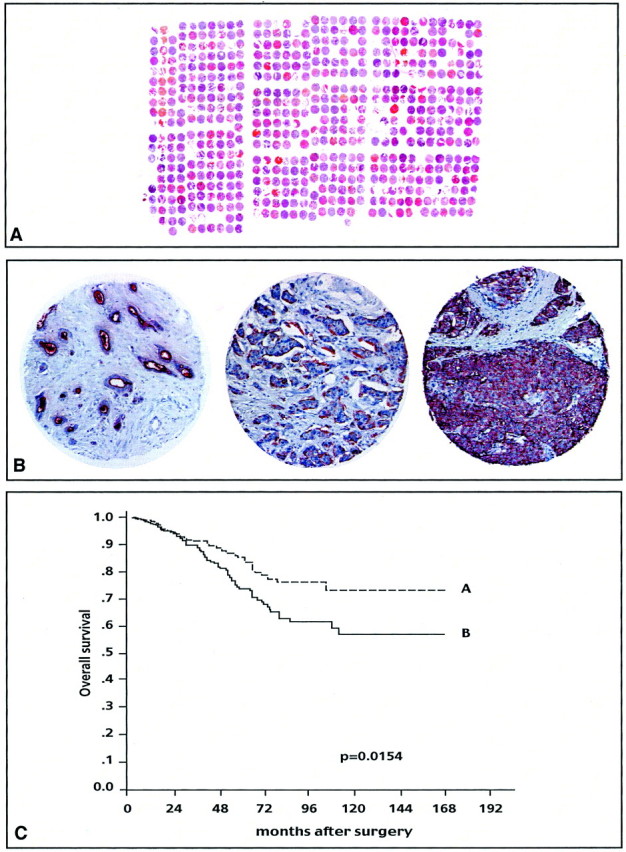
Emerging high-throughput screening technologies are rapidly providing opportunities to identify new diagnostic and prognostic markers and new therapeutic targets in human cancer. Currently, cDNA arrays allow the quantitative measurement of thousands of mRNA expression levels simultaneously. Validation of this tool in hospital settings can be done on large series of archival paraffin-embedded tumor samples using the new technique of tissue microarray. On a series of 55 clinically and pathologically homogeneous breast tumors, we compared for 15 molecules with a proven or suspected role in breast cancer, the mRNA expression levels measured by cDNA array analysis with protein expression levels obtained using tumor tissue microarrays. The validity of cDNA array and tissue microarray data were first verified by comparison with quantitative reverse transcriptase-polymerase chain reaction measurements and immunohistochemistry on full tissue sections, respectively. We found a good correlation between cDNA and tissue array analyses in one-third of the 15 molecules, and no correlation in the remaining two-thirds. Furthermore, protein but not RNA levels may have prognostic value; this was the case for MUC1 protein, which was studied further using a tissue microarray containing approximately 600 tumor samples. For THBS1 the opposite was observed because only RNA levels had prognostic value. Thus, differences extended to clinical prognostic information obtained by the two methods underlining their complementarity and the need for a global molecular analysis of tumors at both the RNA and protein levels.
Figures
Similar articles
-
Expression of transferrin receptor and ferritin H-chain mRNA are associated with clinical and histopathological prognostic indicators in breast cancer.Anticancer Res. 2001 Jan-Feb;21(1B):541-9. Anticancer Res. 2001. PMID: 11299801
-
Prostate epithelium-derived Ets transcription factor mRNA is overexpressed in human breast tumors and is a candidate breast tumor marker and a breast tumor antigen.Clin Cancer Res. 2001 Sep;7(9):2731-8. Clin Cancer Res. 2001. PMID: 11555586
-
cDNA microarray analysis of inflammatory breast cancer signatures.Methods Mol Biol. 2009;512:71-98. doi: 10.1007/978-1-60327-530-9_6. Methods Mol Biol. 2009. PMID: 19347274
-
Multigene classifiers, prognostic factors, and predictors of breast cancer clinical outcome.Adv Anat Pathol. 2009 Jul;16(4):204-15. doi: 10.1097/PAP.0b013e3181a9d4bf. Adv Anat Pathol. 2009. PMID: 19546609 Review.
-
Gene expression profiling of breast cancer.Annu Rev Pathol. 2008;3:67-97. doi: 10.1146/annurev.pathmechdis.3.121806.151505. Annu Rev Pathol. 2008. PMID: 18039137 Review.
Cited by
-
Mass spectrometry-based analysis of formalin-fixed, paraffin-embedded distal cholangiocarcinoma identifies stromal thrombospondin-2 as a potential prognostic marker.J Transl Med. 2020 Sep 4;18(1):343. doi: 10.1186/s12967-020-02498-3. J Transl Med. 2020. PMID: 32887625 Free PMC article.
-
Expression of prolactin receptor and prolactin in normal and malignant thyroid: a tissue microarray study.Endocr Pathol. 2006 Winter;17(4):377-86. doi: 10.1007/s12022-006-0009-x. Endocr Pathol. 2006. PMID: 17525486
-
Overexpression of the Promigratory and Prometastatic PTK7 Receptor Is Associated with an Adverse Clinical Outcome in Colorectal Cancer.PLoS One. 2015 May 11;10(5):e0123768. doi: 10.1371/journal.pone.0123768. eCollection 2015. PLoS One. 2015. PMID: 25962058 Free PMC article.
-
A novel cell array technique for high-throughput, cell-based analysis.In Vitro Cell Dev Biol Anim. 2005 Jul-Aug;41(7):185-7. doi: 10.1290/0505032.1. In Vitro Cell Dev Biol Anim. 2005. PMID: 16223332
-
Integrated analysis highlights APC11 protein expression as a likely new independent predictive marker for colorectal cancer.Sci Rep. 2018 May 9;8(1):7386. doi: 10.1038/s41598-018-25631-1. Sci Rep. 2018. PMID: 29743633 Free PMC article.
References
-
- Bertucci F, Houlgatte R, Benziane A, Granjeaud S, Adelaide J, Tagett R, Loriod B, Jacquemier J, Viens P, Jordan B, Birnbaum D, Nguyen C: Expression profiling in primary breast carcinomas using arrays of candidate genes. Hum Mol Genet 2000, 9:2981-2991 - PubMed
-
- Dhanasekaran SM, Barrette TR, Ghosh D, Shah R, Varambally S, Kurachi K, Pientas KJ, Rubin MA, Chinnaiyan AM: Delineation of prognostic biomarkers in prostate cancer. Nature 2001, 412:822-825 - PubMed
-
- Shipp MA, Ross KN, Tamayo P, Weng A, Kutok JL, Aguiar RCT, Gaasenbeek M, Angelo M, Reich M, Pinkus GS, Ray TS, Koval MA, Last KW, Norton A, Lister TA, Mesirov J, Neuberg DS, Lander ES, Aster JC, Golub TR: Diffuse large B-cell lymphoma outcome prediction by gene-expression profiling and supervised machine learning. Nat Med 2002, 8:68-74 - PubMed
-
- Van’t Veer LJ, Dai H, van de Vijver M, He YD, Hart AAM, Mao M, Peterse HL, van der Kooy K, Marton MJ, Witteveen AT, Schreiber GJ, Kerkhoven RM, Roberts C, Linsley PS, Bernards R, Friend SH: Gene expression profiling predicts clinical outcome of breast cancer. Nature 2002, 415:530-535 - PubMed
-
- Bertucci F, Houlgatte R, Nguyen C, Viens P, Jordan B, Birnbaum D: Gene expression profiling of cancer using DNA arrays: how far from the clinic? Lancet Oncol 2001, 2:674-682 - PubMed
Publication types
MeSH terms
Substances
LinkOut - more resources
Full Text Sources
Other Literature Sources
Medical
Research Materials
Miscellaneous
