. 2002 Oct;12(10):1466-82.
doi: 10.1101/gr.331902.

Identification and analysis of over 2000 ribosomal protein pseudogenes in the human genome

Affiliations

Identification and analysis of over 2000 ribosomal protein pseudogenes in the human genome

Zhaolei Zhang et al. Genome Res. 2002 Oct.

Abstract

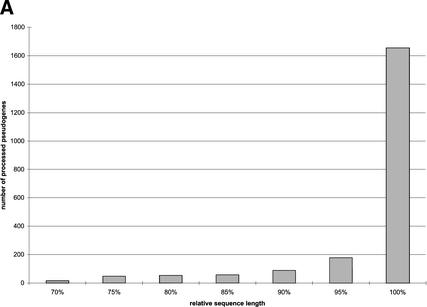
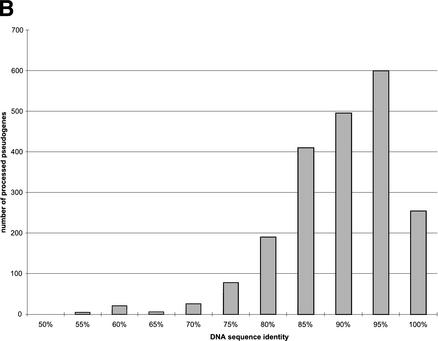
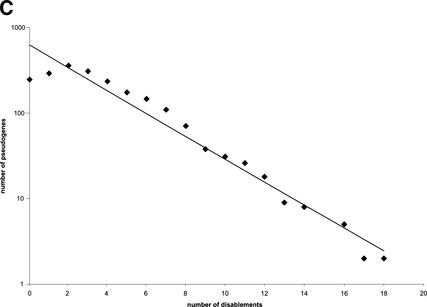
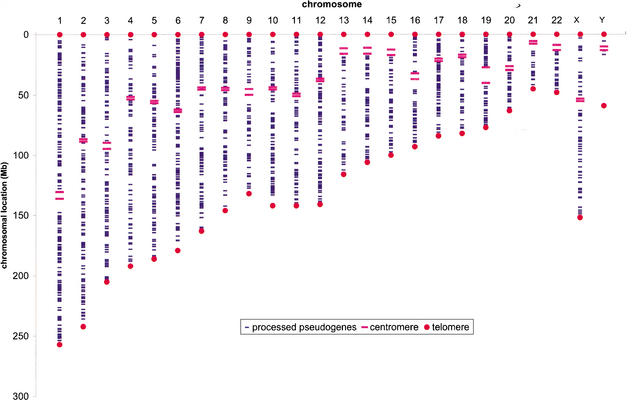
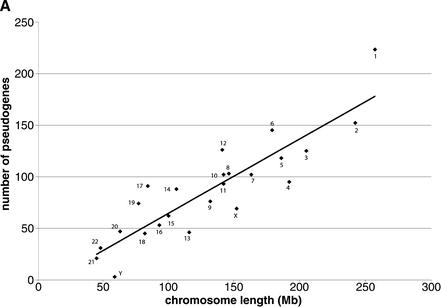
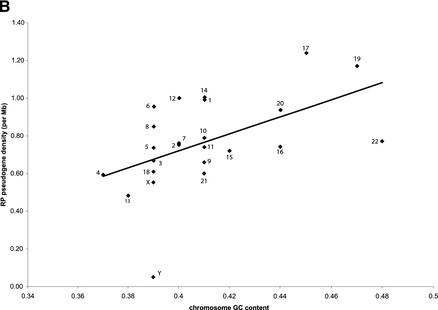
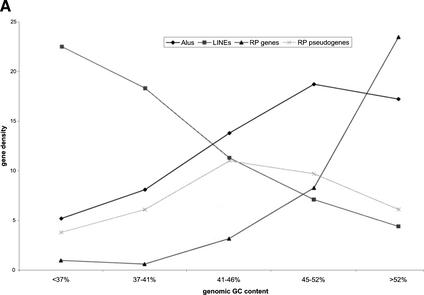
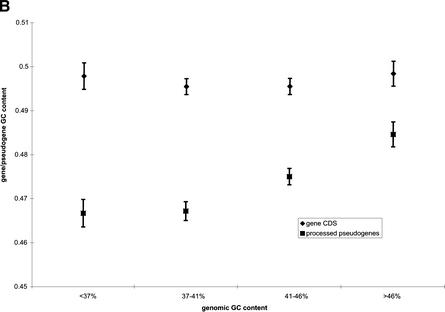
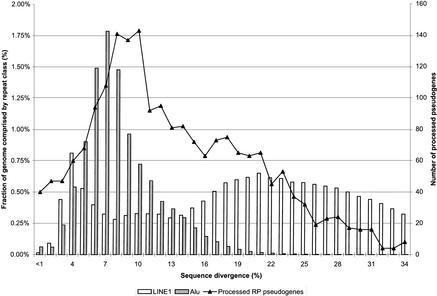
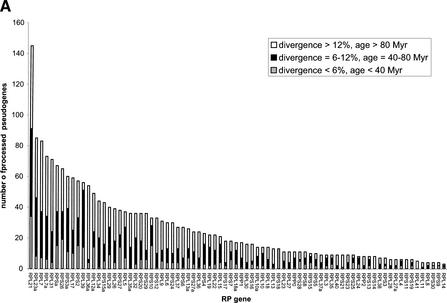
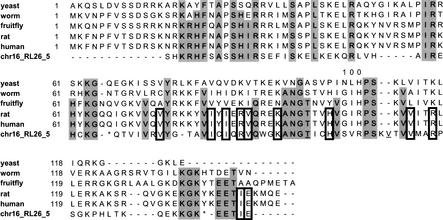
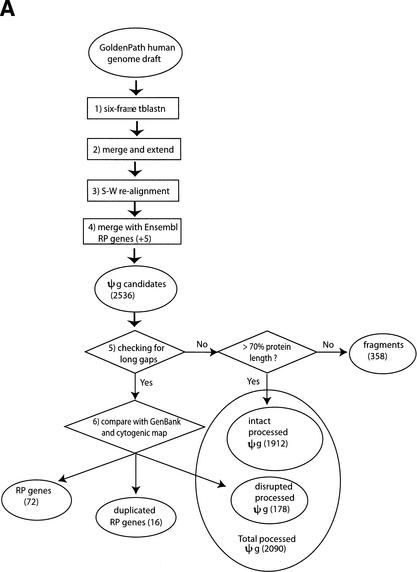
Mammals have 79 ribosomal proteins (RP). Using a systematic procedure based on sequence-homology, we have comprehensively identified pseudogenes of these proteins in the human genome. Our assignments are available at http://www.pseudogene.org or http://bioinfo.mbb.yale.edu/genome/pseudogene. In total, we found 2090 processed pseudogenes and 16 duplications of RP genes. In relation to the matching parent protein, each of the processed pseudogenes has an average relative sequence length of 97% and an average sequence identity of 76%. A small number (258) of them do not contain obvious disablements (stop codons or frameshifts) and, therefore, could be mistaken as functional genes, and 178 are disrupted by one or more repetitive elements. On average, processed pseudogenes have a longer truncation at the 5' end than the 3' end, consistent with the target-primed-reverse-transcription (TPRT) mechanism. Interestingly, on chromosome 16, an RPL26 processed pseudogene was found in the intron region of a functional RPS2 gene. The large-scale distribution of RP pseudogenes throughout the genome appears to result, chiefly, from random insertions with the numbers on each chromosome, consequently, proportional to its size. In contrast to RP genes, the RP pseudogenes have the highest density in GC-intermediate regions (41%-46%) of the genome, with the density pattern being between that of LINEs and Alus. This can be explained by a negative selection theory as we observed that GC-rich RP pseudogenes decay faster in GC-poor regions. Also, we observed a correlation between the number of processed pseudogenes and the GC content of the associated functional gene, i.e., relatively GC-poor RPs have more processed pseudogenes. This ranges from 145 pseudogenes for RPL21 down to 3 pseudogenes for RPL14. We were able to date the RP pseudogenes based on their sequence divergence from present-day RP genes, finding an age distribution similar to that for Alus. The distribution is consistent with a decline in retrotransposition activity in the hominid lineage during the last 40 Myr. We discuss the implications for retrotransposon stability and genome dynamics based on these new findings.


Figures

Figure 1
Figure 1
RP processed pseudogenes statistics. (A) Distribution of relative sequence length among processed pseudogenes. Relative sequence length is the ratio between the length of translated pseudogene and the length of the corresponding functional ribosomal protein. (B) Distribution of the DNA sequence identity between processed pseudogenes and the cDNA sequence of functional RP proteins. (C) Distribution of number of disablements among processed pseudogenes.
Figure 1
Figure 1
RP processed pseudogenes statistics. (A) Distribution of relative sequence length among processed pseudogenes. Relative sequence length is the ratio between the length of translated pseudogene and the length of the corresponding functional ribosomal protein. (B) Distribution of the DNA sequence identity between processed pseudogenes and the cDNA sequence of functional RP proteins. (C) Distribution of number of disablements among processed pseudogenes.
Figure 2
Figure 2
The human RP processed pseudogene population. Twenty-four human chromosomes are shown vertically from left to right. Pseudogenes are represented as short blue horizontal bars; long thick red horizontal bars delimit centromere region. Red dots represent chromosome ends.
Figure 3
Figure 3
(A) Correlation between chromosome length and number of processed RP pseudogenes on them. Each ♦ symbol represents a chromosome. The correlation between number of processed pseudogenes on each chromosome and chromosome length is 0.89, P<1E-8. (B) Processed pseudogene density on each chromosome is correlated with the chromosome GC content. The correlation coefficient is 0.51, P<0.01.
Figure 3
Figure 3
(A) Correlation between chromosome length and number of processed RP pseudogenes on them. Each ♦ symbol represents a chromosome. The correlation between number of processed pseudogenes on each chromosome and chromosome length is 0.89, P<1E-8. (B) Processed pseudogene density on each chromosome is correlated with the chromosome GC content. The correlation coefficient is 0.51, P<0.01.
Figure 4
Figure 4
(A) Distribution of Alu elements, LINE elements, processed RP pseudogenes, and functional RP genes among genomic regions of different GC content. Because of their different abundance in genome, these four species are plotted on different scales: number per 10Kb for Alus and LINEs, number per Mb for RP pseudogenes, and number per 100 Mb for functional RP genes. (B) The drift in GC content for RP processed pseudogenes. (♦) The GC content of functional RP gene coding sequence (CDS). (▪) The GC content of processed pseudogenes. The vertical bars are standard errors.
Figure 4
Figure 4
(A) Distribution of Alu elements, LINE elements, processed RP pseudogenes, and functional RP genes among genomic regions of different GC content. Because of their different abundance in genome, these four species are plotted on different scales: number per 10Kb for Alus and LINEs, number per Mb for RP pseudogenes, and number per 100 Mb for functional RP genes. (B) The drift in GC content for RP processed pseudogenes. (♦) The GC content of functional RP gene coding sequence (CDS). (▪) The GC content of processed pseudogenes. The vertical bars are standard errors.
Figure 5
Figure 5
Distribution of sequence divergence for RP processed pseudogenes in comparison with Alu and LINE1 repeats. Pseudogenes and repeats were grouped into bins according to their sequence divergence from consensus sequences. Each increment in divergence represents roughly 6.6 million years (Myr). The LINE and Alu data are from A. Smit (pers. comm.).
Figure 6
Figure 6
(A) Distribution of processed pseudogenes among RP genes. Bars of different shades represent different age groups. (B) Lack of correlation between mRNA transcript length and number of processed pseudogenes. The pseudogenes are grouped into bins according to the length of their mRNA transcripts. Vertical bars are standard errors. (C) Significant inverse correlation between GC content of RP gene coding sequence (CDS) and number of processed pseudogenes for that RP. The RP genes are grouped into four bins according to their CDS GC content.
Figure 6
Figure 6
(A) Distribution of processed pseudogenes among RP genes. Bars of different shades represent different age groups. (B) Lack of correlation between mRNA transcript length and number of processed pseudogenes. The pseudogenes are grouped into bins according to the length of their mRNA transcripts. Vertical bars are standard errors. (C) Significant inverse correlation between GC content of RP gene coding sequence (CDS) and number of processed pseudogenes for that RP. The RP genes are grouped into four bins according to their CDS GC content.
Figure 7
Figure 7
Amino acid sequence alignment of RPL26 genes from yeast, worm, fruit fly, rat, and human, and a processed pseudogene (chr16_RL26_5) found in the intron region of the human functional RPS2 gene. The residues highlighted in gray are those present in the pseudogene and also in both the mammalian and invertebrate proteins; the residues outlined in bold are those present in the pseudogene and the mammals but not in invertebrates. In the pseudogene sequence, * represents a stop codon, and an underscored amino acid indicates an adjacent frame shift. Rat and human RPL26 have almost identical sequences except at position 100, where the rat protein and the pseudogene have an Arginine and human protein has a Histidine.
Figure 8
Figure 8
(A) Flow chart of the procedure for searching for RP pseudogenes in the human genome. RP and ΨG denote “ribosomal protein” and “pseudogene”, respectively. S-W., “Smith-Waterman”. The steps are as follows: (1) Six-frame BLAST run searching for RP homologies in the human genome. (2) Merging and extension. BLAST hits were merged and extended on both sides to match the length of RP peptide sequence. (3) Smith-Waterman realignment. Extended homologies were realigned with RP sequence. (4) Comparison with Ensembl annotation. Five RPL41 pseudogenes from Ensembl were added to the set. A total of 2536 PR genes or pseudogenes were identified. (5) Checking for long gaps. Homology sequences that contained gaps shorter than 60 bp were labeled “intact processed pseudogenes” if they were longer than 70% of the full-length RP sequence; otherwise they were labeled “pseudogenic fragments”. (6) Comparison with GenBank and cytogenic mappings. For those RP homologies that contained long gaps (>60 bp), their sequences were compared with the RP exon structure from GenBank and their chromosomal locations were checked with cytogenic mapping. The homology sequences were assigned as functional RP genes, duplicated RP genes, and “disrupted processed pseudogenes.” The latter were processed pseudogenes whose sequences were interrupted by retrotransposons. (B) Schematic graph describing the considerations in merging two adjacent RP matches, M1 and M2. (c11, c12) and (c21, c22) are chromosomal coordinates for M1 and M2. (q11, q12) and (q21, q22) are corresponding regions on the query RP protein that they match.
Figure 8
Figure 8
(A) Flow chart of the procedure for searching for RP pseudogenes in the human genome. RP and ΨG denote “ribosomal protein” and “pseudogene”, respectively. S-W., “Smith-Waterman”. The steps are as follows: (1) Six-frame BLAST run searching for RP homologies in the human genome. (2) Merging and extension. BLAST hits were merged and extended on both sides to match the length of RP peptide sequence. (3) Smith-Waterman realignment. Extended homologies were realigned with RP sequence. (4) Comparison with Ensembl annotation. Five RPL41 pseudogenes from Ensembl were added to the set. A total of 2536 PR genes or pseudogenes were identified. (5) Checking for long gaps. Homology sequences that contained gaps shorter than 60 bp were labeled “intact processed pseudogenes” if they were longer than 70% of the full-length RP sequence; otherwise they were labeled “pseudogenic fragments”. (6) Comparison with GenBank and cytogenic mappings. For those RP homologies that contained long gaps (>60 bp), their sequences were compared with the RP exon structure from GenBank and their chromosomal locations were checked with cytogenic mapping. The homology sequences were assigned as functional RP genes, duplicated RP genes, and “disrupted processed pseudogenes.” The latter were processed pseudogenes whose sequences were interrupted by retrotransposons. (B) Schematic graph describing the considerations in merging two adjacent RP matches, M1 and M2. (c11, c12) and (c21, c22) are chromosomal coordinates for M1 and M2. (q11, q12) and (q21, q22) are corresponding regions on the query RP protein that they match.

Similar articles

Cited by

References

    1. Altschul SF, Madden TL, Schaffer AA, Zhang J, Zhang Z, Miller W, Lipman DJ. Gapped BLAST and PSI-BLAST: A new generation of protein database search programs. Nucleic Acids Res. 1997;25:3389–3402. - PMC - PubMed
    1. Bairoch A, Apweiler R. The SWISS-PROT protein sequence database and its supplement TrEMBL in 2000. Nucleic Acids Res. 2000;28:45–48. - PMC - PubMed
    1. Ban N, Nissen P, Hansen J, Moore PB, Steitz T. The complete atomic structure of the large ribosomal subunit at 2.4 A resolution. Nature. 2000;400:841–847. - PubMed
    1. Bernardi G. Isochores and the evolutionary genomics of vertebrates. Gene. 2000;241:3–17. - PubMed
    1. ————— Misunderstandings about isochores. Part 1. Gene. 2001;276:3–13. - PubMed

Publication types

MeSH terms

Substances

LinkOut - more resources