

Factors influencing the identification of transcription factor binding sites by cross-species comparison
- PMID: 12368244
- PMCID: PMC187528
- DOI: 10.1101/gr.323602
Factors influencing the identification of transcription factor binding sites by cross-species comparison
Abstract
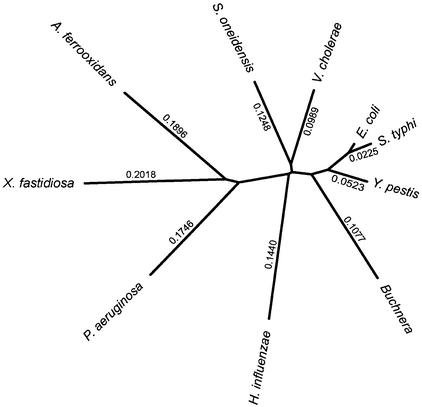
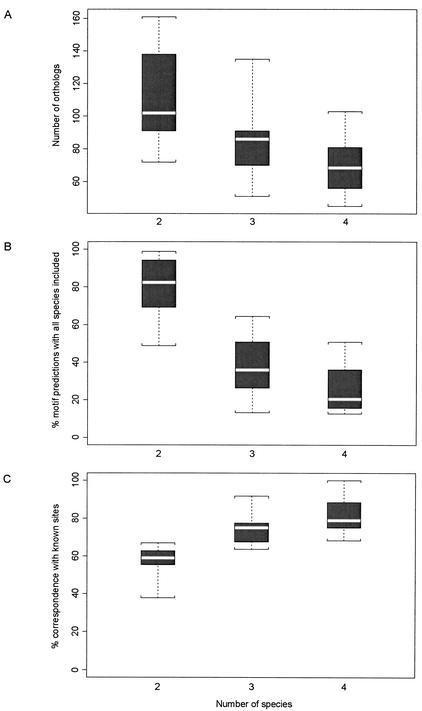
As the number of sequenced genomes has grown, the questions of which species are most useful and how many genomes are sufficient for comparison have become increasingly important for comparative genomics studies. We have systematically addressed these questions with respect to phylogenetic footprinting of transcription factor (TF) binding sites in the gamma-proteobacteria, and have evaluated the statistical significance of our motif predictions. We used a study set of 166 Escherichia coli genes that have experimentally identified TF binding sites upstream of the gene, with orthologous data from nine additional gamma-proteobacteria for phylogenetic footprinting. Just three species were sufficient for approximately 74.0% of the motif predictions to correspond to the experimentally reported E. coli sites, and important characteristics to consider when choosing species were phylogenetic distance, genome size, and natural habitat. We also performed simulations using randomized data to determine the critical maximum a posteriori probability (MAP) values for statistical significance of our motif predictions (P = 0.05). Approximately 60% of motif predictions containing sites from just three species had average MAP values above these critical MAP values. The inclusion of a species very closely related to E. coli increased the number of statistically significant motif predictions, despite substantially increasing the critical MAP value.
Figures

References
-
- Azam TA, Ishihama A. Twelve species of the nucleoid-associated protein from Escherichia coli: Sequence recognition specificity and DNA binding affinity. J Biol Chem. 1999;274:33105–33113. - PubMed
-
- Behr MA, Wilson MA, Gill WP, Salamon H, Schoolnik GK, Rane S, Small PM. Comparative genomics of BCG vaccines by whole-genome DNA microarray. Science. 1999;284:1520–1523. - PubMed
-
- Blanchette M, Schwikowski B, Tompa M. Algorithms for phylogenetic footprinting. J Comput Biol. 2002;9:211–223. - PubMed
-
- Cliften PF, Hillier LW, Fulton L, Graves T, Miner T, Gish WR, Waterston RH, Johnston M. Surveying Saccharomyces genomes to identify functional elements by comparative DNA sequence analysis. Genome Res. 2001;11:1175–1186. - PubMed
Publication types
MeSH terms
Substances
Grants and funding
LinkOut - more resources
Full Text Sources
Molecular Biology Databases
Miscellaneous