

Comparative analysis of multiple genome-scale data sets
- PMID: 12368249
- PMCID: PMC187537
- DOI: 10.1101/gr.225402
Comparative analysis of multiple genome-scale data sets
Abstract
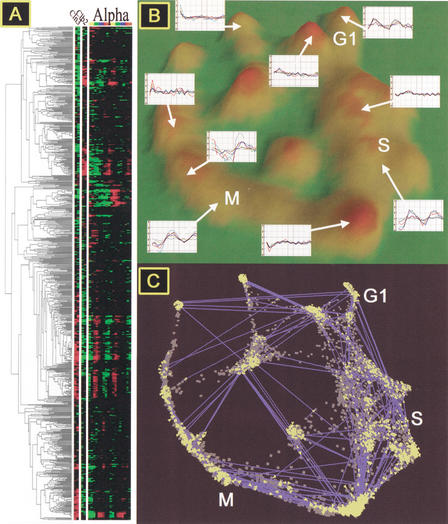
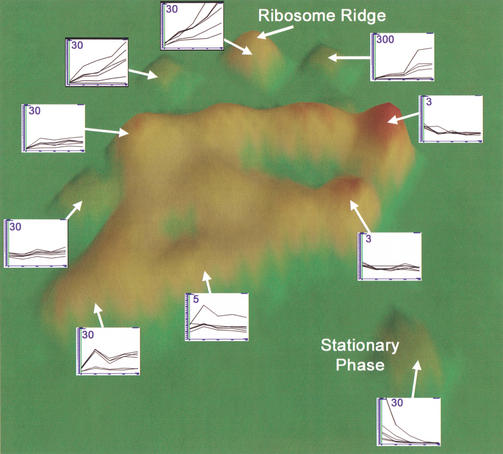
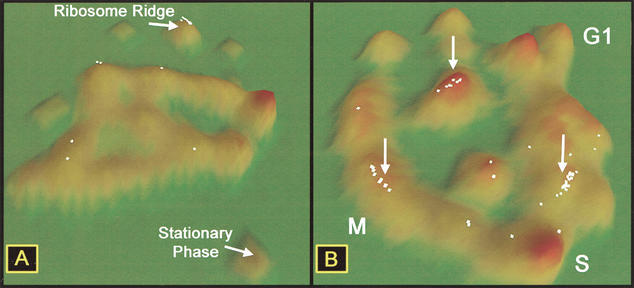
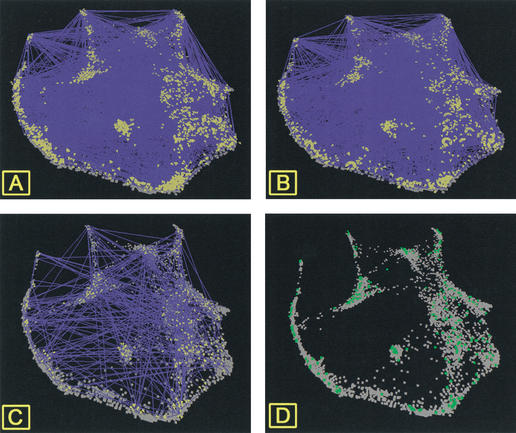
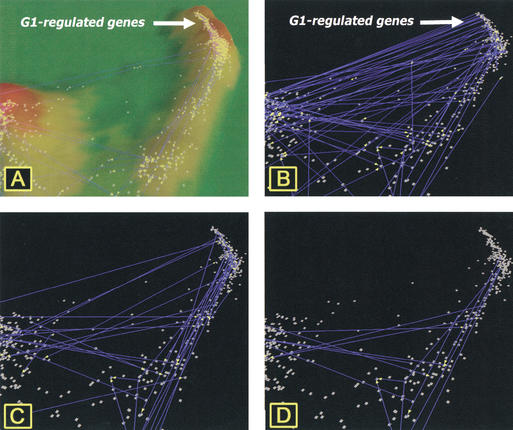
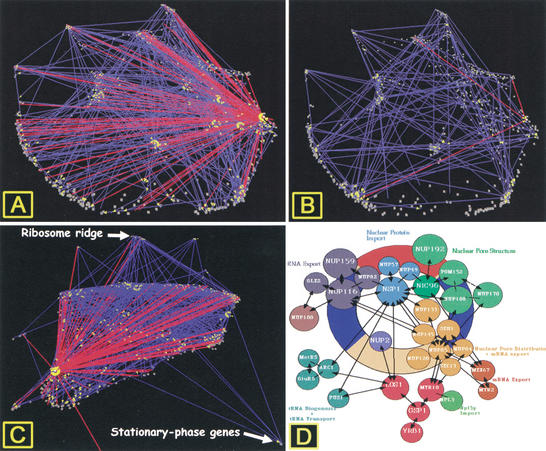
The ongoing analyses of published genome-scale data sets is evidence that different approaches are required to completely mine this data. We report the use of novel tools for both visualization and data set comparison to analyze yeast gene-expression (cell cycle and exit from stationary phase/G(0)) and protein-interaction studies. This analysis led to new insights about each data set. For example, G(1)-regulated genes are not co-regulated during exit from stationary phase, indicating that the cells are not synchronized. The tight clustering of other genes during exit from stationary-phase data set further indicates the physiological responses during G(0) exit are separable from cell-cycle events. Comparison of the two data sets showed that ribosomal-protein genes cluster tightly during exit from stationary phase, but are found in three significantly different clusters in the cell-cycle data set. Two protein-interaction data sets were also compared with the gene-expression data. Visual analysis of the complete data sets showed no clear correlation between co-expression of genes and protein interactions, in contrast to published reports examining subsets of the protein-interaction data. Neither two-hybrid study identified a large number of interactions between ribosomal proteins, consistent with recent structural data, indicating that for both data sets, the identification of false-positive interactions may be lower than previously thought.
Figures

Similar articles
-
Genomic analysis of stationary-phase and exit in Saccharomyces cerevisiae: gene expression and identification of novel essential genes.Mol Biol Cell. 2004 Dec;15(12):5295-305. doi: 10.1091/mbc.e03-11-0856. Epub 2004 Sep 29. Mol Biol Cell. 2004. PMID: 15456898 Free PMC article.
-
Systematic quantification of gene interactions by phenotypic array analysis.Genome Biol. 2004;5(7):R49. doi: 10.1186/gb-2004-5-7-r49. Epub 2004 Jun 29. Genome Biol. 2004. PMID: 15239834 Free PMC article.
-
Influence of microarrays experiments missing values on the stability of gene groups by hierarchical clustering.BMC Bioinformatics. 2004 Aug 23;5:114. doi: 10.1186/1471-2105-5-114. BMC Bioinformatics. 2004. PMID: 15324460 Free PMC article.
-
[Decade of genomics--methods for genome investigation in yeast Saccharomyces cerevisiae].Postepy Biochem. 2006;52(4):435-47. Postepy Biochem. 2006. PMID: 17536513 Review. Polish.
-
Treasures and traps in genome-wide data sets: case examples from yeast.Nat Rev Genet. 2002 Sep;3(9):653-61. doi: 10.1038/nrg886. Nat Rev Genet. 2002. PMID: 12209140 Review.
Cited by
-
Isolation of quiescent and nonquiescent cells from yeast stationary-phase cultures.J Cell Biol. 2006 Jul 3;174(1):89-100. doi: 10.1083/jcb.200604072. J Cell Biol. 2006. PMID: 16818721 Free PMC article.
-
Characterization of differentiated quiescent and nonquiescent cells in yeast stationary-phase cultures.Mol Biol Cell. 2008 Mar;19(3):1271-80. doi: 10.1091/mbc.e07-07-0666. Epub 2008 Jan 16. Mol Biol Cell. 2008. PMID: 18199684 Free PMC article.
-
Biologic pathways associated with relapse in childhood acute lymphoblastic leukemia: a Children's Oncology Group study.Blood. 2006 Jul 15;108(2):711-7. doi: 10.1182/blood-2006-02-002824. Blood. 2006. PMID: 16822902 Free PMC article.
-
Exploiting amino acid composition for predicting protein-protein interactions.PLoS One. 2009 Nov 20;4(11):e7813. doi: 10.1371/journal.pone.0007813. PLoS One. 2009. PMID: 19936254 Free PMC article.
-
Bacterial postgenomics: the promise and peril of systems biology.J Bacteriol. 2006 Dec;188(23):7999-8004. doi: 10.1128/JB.01195-06. Epub 2006 Sep 22. J Bacteriol. 2006. PMID: 16997947 Free PMC article. No abstract available.
References
-
- Aach J, Rindone W, Church G. Systematic management and analysis of yeast gene expression data. Genome Res. 2000;10:431–445. - PubMed
-
- Chu S, DeRisi J, Eisen M, Mulholland J, Botstein D, Brown PO, Herskowitz I. The transciptional program of sporulation in budding yeast. Science. 1998;282:699–705. - PubMed
-
- Clark W, Gillespie DAF. Transformation by v-Jun prevents cell cycle exit and promotes apoptosis in the absence of serum growth factors. Cell Growth Differ. 1997;8:371–380. - PubMed
Publication types
MeSH terms
Substances
Grants and funding
LinkOut - more resources
Full Text Sources
Other Literature Sources
Molecular Biology Databases