Comparative Study
. 2002 Oct;12(10):1574-81.
doi: 10.1101/gr.397002.

Judging the quality of gene expression-based clustering methods using gene annotation

Affiliations
Comparative Study

Judging the quality of gene expression-based clustering methods using gene annotation

Francis D Gibbons et al. Genome Res. 2002 Oct.

Abstract

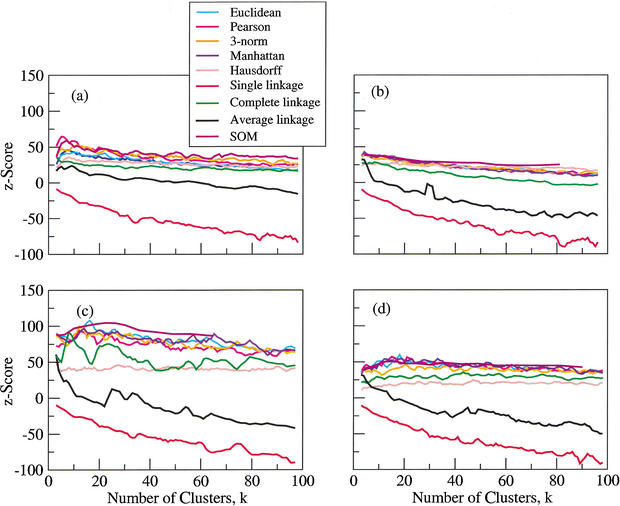
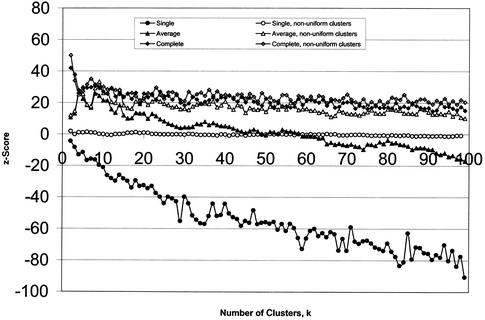
We compare several commonly used expression-based gene clustering algorithms using a figure of merit based on the mutual information between cluster membership and known gene attributes. By studying various publicly available expression data sets we conclude that enrichment of clusters for biological function is, in general, highest at rather low cluster numbers. As a measure of dissimilarity between the expression patterns of two genes, no method outperforms Euclidean distance for ratio-based measurements, or Pearson distance for non-ratio-based measurements at the optimal choice of cluster number. We show the self-organized-map approach to be best for both measurement types at higher numbers of clusters. Clusters of genes derived from single- and average-linkage hierarchical clustering tend to produce worse-than-random results.


Figures

Figure 1
Figure 1
Schematic of dataflow in clustering and evaluation.
Figure 2
Figure 2
Four data sets clustered using k-means, hierarchical, and self-organized map algorithms. The horizontal axis shows the number of clusters desired, and the vertical axis shows z-scores. Data sets are (a) Cho, (b) CJRR, (c) Gasch, and (d) Spellman.
Figure 3
Figure 3
Hierarchical single- and average-linkage clustering results, scored against random assignment to clusters of uniform size (solid symbols), and random assignment to clusters of the same size as the clades obtained by hierarchical clustering (open symbols). For single linkage (circles), the difference is strongest, reflecting the strong tendency of that algorithm to produce nonuniformly sized clusters (indicated by the negative scores of the solid circles) that do not contain any functional information (evidenced by the open circles, which show that even taking account for the cluster sizes produced, the score is equivalent to random assignment). The scores for complete linkage show little difference (open and solid diamonds are almost on top of each other), indicating that the cluster sizes returned by this algorithm are indicative of actual clusters in the data. Average linkage occupies the middle ground (triangles).
Figure 4
Figure 4
Mutual information (MI) as a function of number of gene pairs swapped between clusters. At each permutation, two genes are chosen at random from each of two randomly chosen clusters (there are 30 clusters in all). The genes are swapped, and the MI (between cluster membership and attribute possession) is recomputed. For convenience, the MI is shown as a fraction of its initial value. It is clear that MI decreases monotonically as the genes are swapped, illustrating that it is a good gauge of the quality of the clusters. It does not fall to zero because even with random assignment of genes to clusters, it is likely that genes will coincidentally end up in the same cluster. (Clusters taken from Tavazoie et al. 1999.)
Figure 5
Figure 5
U for all attribute pairs, after removing one of each pair with U > 0.9999. Histogram showing uncertainty coefficient between all pairs of attributes, after removing one of each pair with U > 0.9999. When a pair of attributes has U = 0, there is no correlation between possession of one attribute by a gene, and possession of the other. When U = 1.0, they are completely correlated: if a gene has one attribute, it will certainly also have the other.

References

    1. Aach J, Rindone W, Church GM. Systematic management and analysis of yeast gene expression data. Genome Res. 2000;10:431–445. - PubMed
    1. Angelo M. GeneCluster. Cambridge, MA: Whitehead/MIT Center for Genome Research; 1999. http://www.genome.wi.mit.edu/cancer/software/software.html ; http://www.genome.wi.mit.edu/cancer/software/software.html. .
    1. Ashburner M, Ball CA, Blake JA, Botstein D, Butler H, Cherry JM, Davis AP, Dolinski K, Dwight SS, Eppig JT, et al. Gene ontology: Tool for the unification of biology. Nat Genet. 2000;25:25–29. - PMC - PubMed
    1. Beazley DM. SWIG User's Manual v.1.3; 2001. http://www.swig.org http://www.swig.org. .
    1. Beazley DM, Fletcher D, Dumont D. O'Reilly Perl Conference 2.0. 1998. Perl extension building with SWIG.http://www.swig.org/papers/Per198/swigperl.pdf San Jose, CA; http://www.swig.org/papers/Per198/swigperl.pdf. .

Publication types

MeSH terms

LinkOut - more resources