

Using text analysis to identify functionally coherent gene groups
- PMID: 12368251
- PMCID: PMC187532
- DOI: 10.1101/gr.116402
Using text analysis to identify functionally coherent gene groups
Abstract
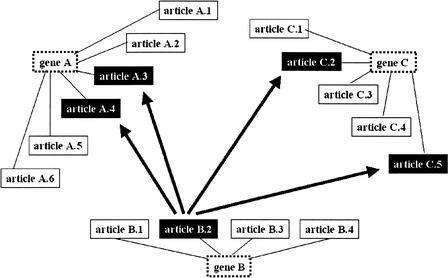
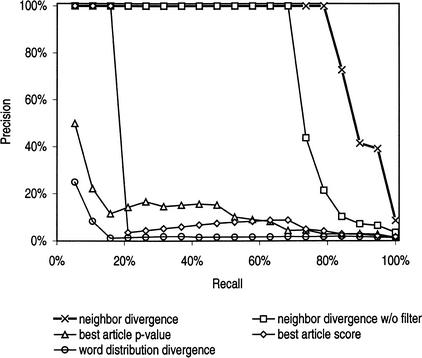
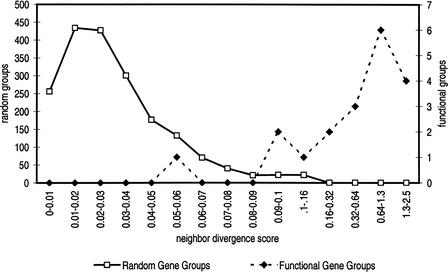
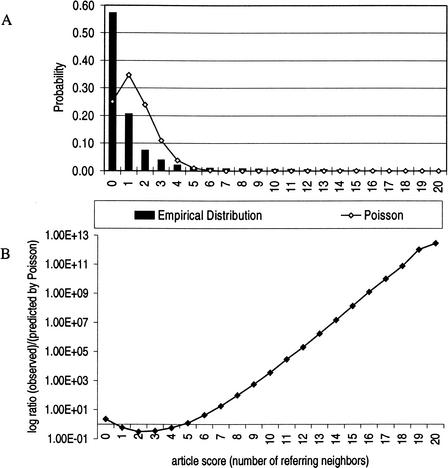
The analysis of large-scale genomic information (such as sequence data or expression patterns) frequently involves grouping genes on the basis of common experimental features. Often, as with gene expression clustering, there are too many groups to easily identify the functionally relevant ones. One valuable source of information about gene function is the published literature. We present a method, neighbor divergence, for assessing whether the genes within a group share a common biological function based on their associated scientific literature. The method uses statistical natural language processing techniques to interpret biological text. It requires only a corpus of documents relevant to the genes being studied (e.g., all genes in an organism) and an index connecting the documents to appropriate genes. Given a group of genes, neighbor divergence assigns a numerical score indicating how "functionally coherent" the gene group is from the perspective of the published literature. We evaluate our method by testing its ability to distinguish 19 known functional gene groups from 1900 randomly assembled groups. Neighbor divergence achieves 79% sensitivity at 100% specificity, comparing favorably to other tested methods. We also apply neighbor divergence to previously published gene expression clusters to assess its ability to recognize gene groups that had been manually identified as representative of a common function.
Figures
Similar articles
-
The computational analysis of scientific literature to define and recognize gene expression clusters.Nucleic Acids Res. 2003 Aug 1;31(15):4553-60. doi: 10.1093/nar/gkg636. Nucleic Acids Res. 2003. PMID: 12888516 Free PMC article.
-
A literature-based method for assessing the functional coherence of a gene group.Bioinformatics. 2003 Feb 12;19(3):396-401. doi: 10.1093/bioinformatics/btg002. Bioinformatics. 2003. PMID: 12584126 Free PMC article.
-
Influence of microarrays experiments missing values on the stability of gene groups by hierarchical clustering.BMC Bioinformatics. 2004 Aug 23;5:114. doi: 10.1186/1471-2105-5-114. BMC Bioinformatics. 2004. PMID: 15324460 Free PMC article.
-
Comparing algorithms for clustering of expression data: how to assess gene clusters.Methods Mol Biol. 2009;541:479-509. doi: 10.1007/978-1-59745-243-4_21. Methods Mol Biol. 2009. PMID: 19381534 Review.
-
Increasing the efficiency of fuzzy logic-based gene expression data analysis.Physiol Genomics. 2003 Apr 16;13(2):107-17. doi: 10.1152/physiolgenomics.00097.2002. Physiol Genomics. 2003. PMID: 12595578 Review.
Cited by
-
Current awareness on comparative and functional genomics.Comp Funct Genomics. 2003;4(2):277-84. doi: 10.1002/cfg.227. Comp Funct Genomics. 2003. PMID: 18629117 Free PMC article. No abstract available.
-
Literature mining for the discovery of hidden connections between drugs, genes and diseases.PLoS Comput Biol. 2010 Sep 23;6(9):e1000943. doi: 10.1371/journal.pcbi.1000943. PLoS Comput Biol. 2010. PMID: 20885778 Free PMC article.
-
Discovering semantic features in the literature: a foundation for building functional associations.BMC Bioinformatics. 2006 Jan 26;7:41. doi: 10.1186/1471-2105-7-41. BMC Bioinformatics. 2006. PMID: 16438716 Free PMC article.
-
Significance analysis of lexical bias in microarray data.BMC Bioinformatics. 2003 Apr 3;4:12. doi: 10.1186/1471-2105-4-12. Epub 2003 Apr 3. BMC Bioinformatics. 2003. PMID: 12697067 Free PMC article.
-
Combining evidence, biomedical literature and statistical dependence: new insights for functional annotation of gene sets.BMC Bioinformatics. 2006 May 4;7:241. doi: 10.1186/1471-2105-7-241. BMC Bioinformatics. 2006. PMID: 16674810 Free PMC article.
References
-
- Altschul SF, Gish W, Miller W, Myers EW, Lipman DJ. Basic local alignment search tool. J Mol Biol. 1990;215:403–410. - PubMed
-
- Andrade MA, Valencia A. Automatic annotation for biological sequences by extraction of keywords from MEDLINE abstracts. Development of a prototype system. Proc Int Conf Intell Syst Mol Biol. 1997;5:25–32. - PubMed
Publication types
MeSH terms
Grants and funding
LinkOut - more resources
Full Text Sources
Other Literature Sources
Molecular Biology Databases