. 2002 Oct 15;99(21):13391-6.
doi: 10.1073/pnas.212522699. Epub 2002 Oct 4.

Critical points in charged membranes containing cholesterol

Affiliations

Critical points in charged membranes containing cholesterol

Arun Radhakrishnan et al. Proc Natl Acad Sci U S A. .

Abstract

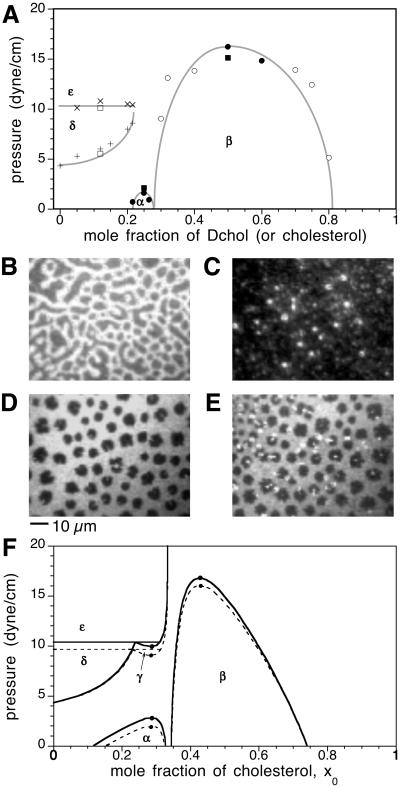
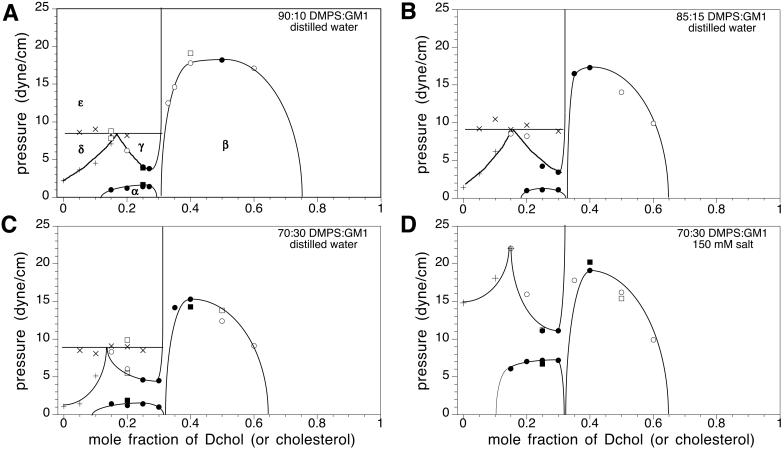
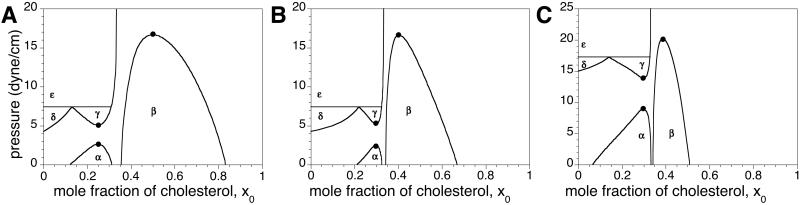
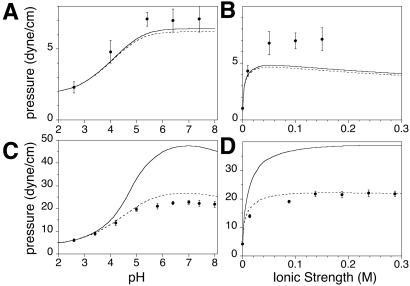
Epifluorescence microscopy is used to determine phase diagrams for lipid monolayers containing binary mixtures of cholesterol or dihydrocholesterol and dimyristoylphosphatidylserine, as well as ternary mixtures that also contain ganglioside G(M1). The phase diagrams are unusual in that they show multiple critical points: two upper miscibility critical points and one lower miscibility critical point. These critical points all are associated with the formation of condensed complexes between these lipids and cholesterol (or dihydrocholesterol). The miscibility critical pressures depend on subphase pH and ionic strength. Changes in critical pressures due to changes in subphase composition are closely related to changes in membrane electrostatic pressure and surface ionization.


Figures

Fig 1.
Fig 1.
Phase diagrams and epifluorescence micrographs of monolayers of binary mixtures of DMPS and Dchol. (A) Experimental pressure-composition phase diagram showing liquid–liquid and solid–liquid immiscibility for a binary monolayer mixture of DMPS and Dchol on a subphase of distilled water at pH 5.4. Plotted data points represent the transition pressures that mark the disappearance or appearance of two-phase coexistence during monolayer compression or expansion. The gray curve is not a fit to theory. α and β denote liquid–liquid two-phase fields, whereas δ and ɛ refer to solid–liquid two-phase fields. Solid domains emerge from a homogeneous liquid background at the points marked by + (see D). At the points marked by x, the identity of the background liquid-phase changes (see E), upon crossing into a different solid–liquid coexistence region (ɛ). Liquid-phase transitions occur at points marked by circles. Spot checks carried out with cholesterol instead of Dchol are shown by squares. Stripe super-structure phases that represent proximity to a critical point (9) were observed at the transitions marked by filled circles (as shown in B) and squares, and not at those marked by open circles and squares. Standard errors for the transition pressures are 3–10% based on three independent measurements (not shown). (B) Monolayer in the α two-phase field composed of 25 mol% Dchol, 74.8 mol% DMPS, and 0.2 mol% TR-DHPE. The surface pressure is 1.4 dyne/cm. Under these conditions, one observes domain shape instability tending toward a stripe phase. (C) Monolayer in the β two-phase field composed of 50 mol% Dchol, 49.8 mol% DMPS, and 0.2 mol% TR-DHPE. The surface pressure is 7.4 dyne/cm. The domains are 1–3 μm in diameter. (D) Monolayer in the δ two-phase field composed of 12 mol% Dchol, 87.8 mol% DMPS, and 0.2 mol% TR-DHPE. The surface pressure is 6.8 dyne/cm. The black domains are irregularly shaped and solid as they do not exhibit thermal fluctuations characteristic of liquid domains (as in B and C). (E) Monolayer in the ɛ two-phase field composed of 12 mol% Dchol, 87.8 mol% DMPS, and 0.2 mol% TR-DHPE. The surface pressure is 11.1 dyne/cm. A new liquid phase forms on the perimeter of the black solid domains, grows, and eventually replaces the background gray liquid phase. B–E have the same scale (scale bar, 10 μm). (F) Calculated pressure-composition phase diagram for a reactive mixture of cholesterol and phospholipid. The δ–ɛ boundary approaches the x0 = 0 axis as the solubility of cholesterol in DMPS approaches zero. Phase boundaries are calculated both in the absence (dotted lines) and presence (solid lines) of double-layer electrostatics. Parameters used are listed in the text. The black dots represent miscibility critical points.
Fig 2.
Fig 2.
Freezing pressures of binary mixtures. Filled and open circles refer to mixtures of DMPS–Dchol and DMPS–GM1, respectively. All measurements were made on a subphase of distilled water at a pH of 5.4. The filled circles also determine the lower boundary of the δ two-phase field of Fig. 1A. Superimposed are calculated freezing pressure elevation curves for the ideal case (no reaction) and for the case of condensed complex formation for different values of n, the cooperativity parameter. The freezing pressure elevation curves are calculated by using Eq. 4 and the parameters listed in the text. In the ideal case (no reaction), xP,l = 1 − xC, where xC is the mole fraction of cholesterol in the sample. In the case of the formation of condensed complexes, xP,l depends on the extent of reaction (Eq. 1). πformula image is 4.3 dyne/cm (Fig. 1A).
Fig 3.
Fig 3.
Experimental pressure-composition phase diagrams for ternary mixtures of Dchol, DMPS, and GM1. The molar ratios of DMPS/GM1 were 90:10 (A), 85:15 (B), and 70:30 (C and D). In A–C, the subphase was distilled water at pH 5.4. In D, the ionic strength of the subphase was 150 mM (NaCl) and the pH was held constant at 5.4 with a citrate-phosphate saline buffer. α, β, and γ are liquid–liquid coexistence regions (phase boundaries are denoted by circles). δ and ɛ are solid–liquid coexistence regions (phase boundaries are marked by + and ×, respectively). Spot checks carried out with cholesterol instead of Dchol are shown by squares. Errors for the transition pressures are 3–15% based on three independent measurements (not shown). The lines drawn to denote the phase boundaries are not fit to theory. Other details are the same as in the Fig. 1A legend.
Fig 4.
Fig 4.
Calculated pressure-composition phase diagrams for binary lipid mixtures. The parameters used are listed in the text except that π = 4 dyne/cm, and n = 1 for A and n = 3 for B. In C, n = 3, n0 = 0.15 mol/liter, and πformula image is 15 dyne/cm. The black dots represent miscibility critical points.
Fig 5.
Fig 5.
Electrostatic effects on critical and freezing pressures. Critical pressures for the α two-phase field of Fig. 3C are measured as a function of pH (at a constant ionic strength of 150 mM) in A and as a function of ionic strength (at a constant pH of 5.4) in B. The composition of the monolayer was 25 mol% Dchol, 52.4 mol% DMPS, 22.4 mol% GM1, and 0.2 mol% TR-DHPE. The stripe superstructure phase is observed for this composition (see Fig. 1B). Calculated increases in electrostatic pressures for the liquid phase (using Eq. 6) are also shown in A and B. Freezing pressures of a monolayer containing 99.8 mol% Dchol and 0.2 mol% TR-DHPE are measured as a function of pH (at a constant ionic strength of 150 mM) in C and as a function of ionic strength (at a constant pH of 5.4) in D. Rigid, dark, and irregular domains are formed at the liquid–solid freezing transition pressure (see Fig. 1D). Calculated increases in freezing pressures are also shown in C and D. The solid lines include the effect of the compressibility of the phospholipid, while the dotted lines do not. The pressure increases are calculated relative to 2.3 and 6 dyne/cm at a pH of 2.6 (for A and C, respectively), and relative to 1 and 4.2 dyne/cm at an ionic strength of 4 μM (for B and D, respectively). The phospholipid is assumed to be no longer compressible for pressures higher than 25 dyne/cm. Other parameters used are listed in the text.

Similar articles

Cited by

References

    1. Subramaniam S. & McConnell, H. M. (1987) J. Phys. Chem. 91, 1715-1718.
    1. McConnell H. M. (1991) Annu. Rev. Phys. Chem. 42, 171-195.
    1. Radhakrishnan A. & McConnell, H. M. (1999) Biophys. J. 77, 1507-1517. - PMC - PubMed
    1. MacDonald R. C., Simon, S. A. & Baer, E. (1976) Biochemistry 15, 885-891. - PubMed
    1. Radhakrishnan A. & McConnell, H. M. (2002) J. Phys. Chem. 106, 4755-4762.

Publication types