Comparative Study
. 2002 Oct;14(10):2383-98.
doi: 10.1105/tpc.004416.

Genomic evidence for COP1 as a repressor of light-regulated gene expression and development in Arabidopsis

Affiliations
Comparative Study

Genomic evidence for COP1 as a repressor of light-regulated gene expression and development in Arabidopsis

Ligeng Ma et al. Plant Cell. 2002 Oct.

Abstract

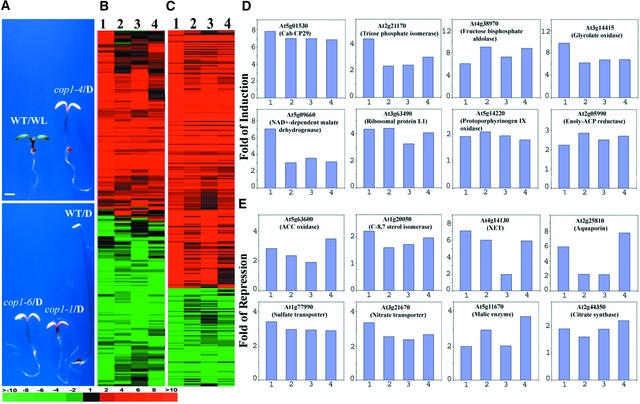
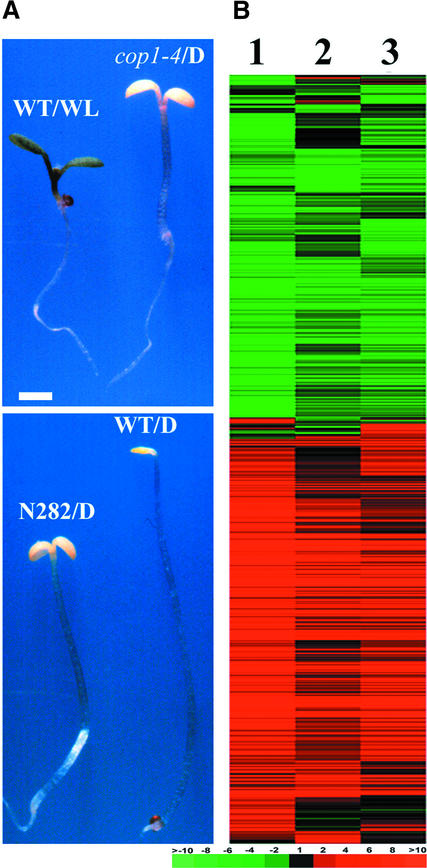
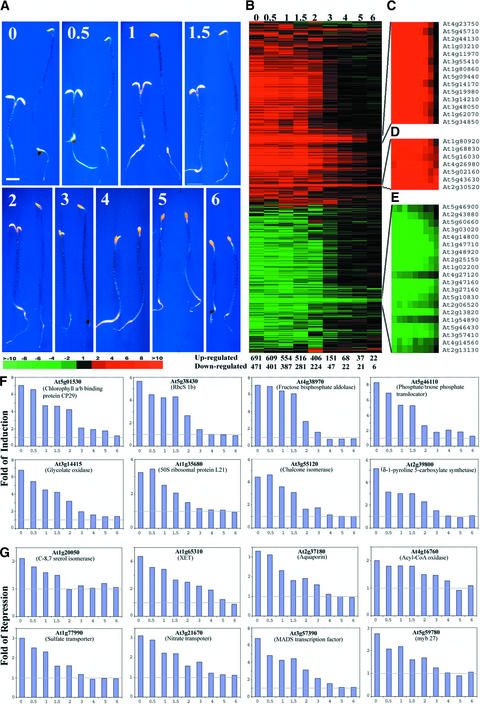
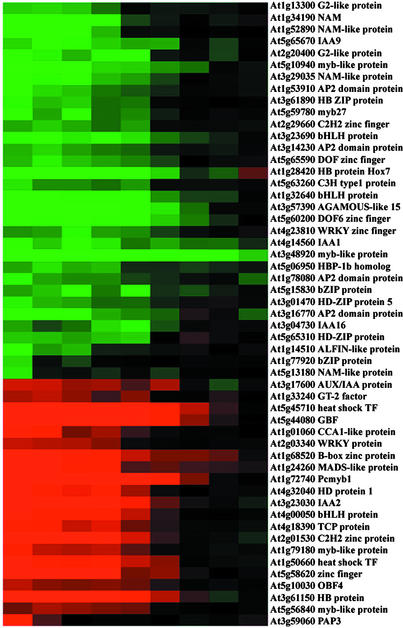
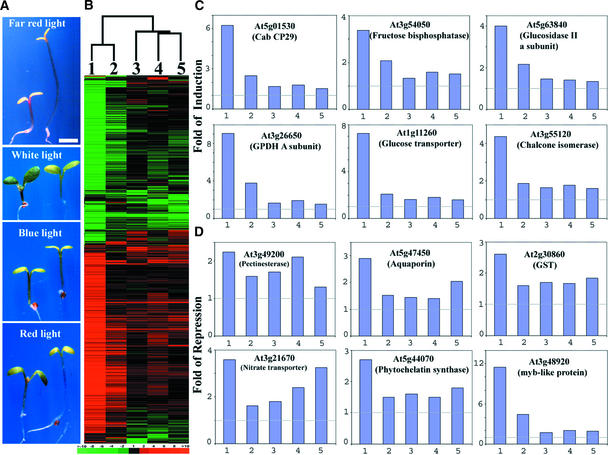
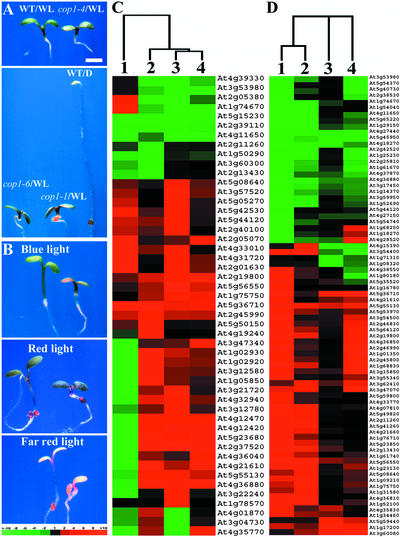
Microarray gene expression profiling was used to examine the role of COP1 in the light control of Arabidopsis genome expression. Qualitatively similar gene expression profiles were observed between wild-type seedlings grown in white light and multiple cop1 mutant alleles grown in the dark. Furthermore, overexpression of the dominant-negative-acting N terminus of COP1 (N282) in darkness produced a genome expression profile similar to those produced by white light and the cop1 mutations. Different cop1 mutant alleles, N282, and light treatment also resulted in distinct expression profiles in a small fraction of the genes examined. In the light, the genome expression of cop1 mutations displayed an exaggerated light response. COP1-regulated genes in the dark were estimated to account for >20% of the genome. Analysis of these COP1-regulated genes revealed that >28 cellular pathways are coordinately but antagonistically regulated by light and COP1. Interestingly, the gene expression regulation attributable to HY5 in the light is included largely within those genes regulated by COP1 in the dark. Thus, this genomic study supports the hypothesis that COP1 acts as a repressor of photomorphogenesis, possibly by controlling the degradation of transcription factors and their target gene expression. The majority of light-controlled genome expression could be accounted for by the negative regulation of COP1 activity.


Figures

Figure 1.
Figure 1.
Genome Expression Profile Comparison between Dark-Grown cop1 Mutants and White Light–Grown Wild-Type Seedlings. (A) Morphological comparison of continuous white light-grown wild-type, dark-grown cop1, and wild-type Arabidopsis seedlings. All seedlings were 6 days old and photographed at the same magnification. D, darkness; WL, white light; WT, wild-type seedlings. Bar = 1 mm. (B) Hierarchical clustering display of expression ratios from wild-type seedlings grown under white light versus dark-grown seedlings and dark-grown cop1 mutants versus dark-grown wild-type seedlings. Only those genes that exhibited twofold or greater differential expression in at least one sample pair among the four tested were included for comparison. A total of 2261 genes were included in the cluster. (C) Overview of the hierarchical cluster display for those genes in our microarray that represent the 28 cellular and metabolic pathways regulated by light and COP1. Only those genes that exhibited twofold or greater differential change in at least one sample pair among the four pairs tested were included for comparison. A total of 311 genes were included in the cluster (see supplementary data at http://plantgenomics.biology.yale.edu/ for details). (D) Expression profiles of eight representative genes from some of the cellular and metabolic pathways upregulated in dark-grown cop1 mutants. (E) Expression profiles of eight representative genes from some of the cellular and metabolic pathways downregulated in dark-grown cop1 mutants. XET, xyloglucan endotransglycosylase. The four bars in each graph of (D) and (E) correspond to the lanes in (B) and (C). Lane 1, expression ratios of white light– and dark-grown wild-type seedlings; lane 2, expression ratios of dark-grown cop1-4 and wild-type seedlings; lane 3, expression ratios of dark-grown cop1-6 and wild-type seedlings; lane 4, expression ratios of dark-grown cop1-1 and wild-type seedlings. The color scale for (B) and (C) is shown at bottom left. See supplementary data at http://plantgenomics.biology.yale.edu/ for more information.
Figure 2.
Figure 2.
Comparison of Genome Expression Profiles among the Dominant-Negative COP1 Mutant Form (N282), the cop1-4 Mutation, and White Light. (A) Morphological comparison of continuous white light–grown wild-type, dark-grown N282, cop1-4, and wild-type Arabidopsis seedlings. All seedlings were 6 days old and photographed at the same magnification. D, darkness; N282, seedling overexpressing the N-terminal 282 amino acids of COP1; WL, white light; WT, wild-type seedlings. Bar = 1 mm. (B) Hierarchical clustering display of expression ratios from wild-type seedlings grown under white light versus darkness, dark-grown N282 seedlings versus dark-grown wild-type seedlings, and dark-grown cop1-4 seedlings versus dark-grown wild-type seedlings. Lane 1, expression ratios of white light– and dark-grown wild-type seedlings; lane 2, expression ratios of dark-grown N282 and wild-type seedlings; lane 3, expression ratios of dark-grown cop1-4 and wild-type seedlings. Only those genes that exhibited twofold or greater differential change in at least one sample pair among the three pairs examined were included for comparison. A total of 2021 genes were included in the cluster (see supplementary data at http://plantgenomics.biology.yale.edu/ for details). The color scale for (B) is shown at bottom right.
Figure 3.
Figure 3.
Kinetics of the Developmental Characteristics and Genome Expression Profile Changes during an in Planta Modulation of COP1 Activity. (A) Phenotypic characteristics of 6-day-old dark-grown wild-type and cop1-6 mutant seedlings grown at 30°C for different times before transfer to 22°C in the dark. In each panel, the cop1-6 mutant seedlings are shown at left and wild-type seedlings are shown at right. Both the cop1-6 and wild-type seedlings were grown for 0, 0.5, 1, 1.5, 2, 3, 4, 5, and 6 days at 30°C before seedlings were transferred to 22°C. All seedlings were 6 days old and photographed at the same magnification. Bar = 1 mm. (B) Overview of the hierarchical cluster display of the genome expression profiles among all treated cop1-6 and wild-type sample pairs shown in (A). Each lane represents the expression ratios of 6-day-old dark-grown cop1-6 and wild-type seedlings that were grown initially at 30°C for various times (days are listed at top). A total of 1484 genes that had twofold or greater differential expression in at least one sample pair were included in the cluster (see supplementary data at http://plantgenomics.biology.yale.edu/ for details). The number of genes exhibiting twofold or greater differential expression between dark-grown cop1-6 and wild-type seedlings changed according to their duration of growth at 30°C before being shifted to 22°C; these values are indicated at bottom. (C) to (E) Three representative subclusters of genes exhibited delayed alteration in their genome expression profiles. (F) Expression profiles of eight representative genes from some of the cellular and metabolic pathways upregulated in the dark-grown cop1-6 mutant. (G) Expression profiles of eight representative genes from some of the cellular and metabolic pathways downregulated in the dark-grown cop1-6 mutant. The expression ratios of genes between the 6-day-old dark-grown cop1-6 and wild-type seedlings shown in (B) to (G) were from seedlings grown at 30°C for 0, 0.5, 1, 1.5, 2, 3, 4, 5, and 6 days before being transferred to 22°C and/or analyzed. The color scale for (B) to (E) is shown at the bottom of (A).
Figure 4.
Figure 4.
COP1 Regulates the Expression of a Large Group of Transcription Factors. All of the transcription factors in our microarray that displayed twofold or greater differential expression in at least one of the nine sample pairs shown in Figure 3B were selected. The expression ratios of those 53 selected transcription factor genes between the 6-day-old dark-grown cop1-6 and wild-type seedlings were from seedlings grown at 30°C for 0, 0.5, 1, 1.5, 2, 3, 4, 5, and 6 days before being transferred to 22°C and/or analyzed. The color scale is shown at bottom.
Figure 5.
Figure 5.
Comparison of the Morphology and Genome Expression Profiles of hy5 Mutant and Wild-Type Seedlings Grown under Four Different Light Quality Conditions. (A) Wild-type and hy5 mutant seedlings grown under different light quality conditions. In each panel, the seedling at left is the wild type and the seedling at right is the hy5 mutant. The seedlings were grown for 6 days in continuous far-red, white, blue, and red light. All seedlings were photographed at the same magnification. Bar = 1 mm. (B) Hierarchical clustering display of expression ratios from wild-type versus hy5 mutant seedlings grown under different light quality conditions. The genome expression profile from dark-grown cop1-6 versus wild-type seedlings is included for comparison. Only those genes that exhibited twofold or greater differential expression in at least one sample pair among the five pairs examined here were included for comparison. A total of 1312 genes were included in the cluster analysis (see supplementary data at http://plantgenomics.biology.yale.edu/ for details). The color scale is shown at bottom. The dendrogram at top indicates the relationship among those data sets across all of the genes included in this clustering analysis. (C) Expression profiles of six representative genes from some of the cellular and metabolic pathways upregulated in the dark-grown cop1-6 mutant. (D) Expression profiles of six representative genes from some of the cellular and metabolic pathways downregulated in the dark-grown cop1-6 mutant. The five bars in each graph of (C) and (D) correspond to the lanes in (B). Lane 1, expression ratios of dark-grown cop1-6 and wild-type seedlings; lane 2, expression ratios of far-red light–grown wild-type and hy5 seedlings; lane 3, expression ratios of white light–grown wild-type and hy5 seedlings; lane 4, expression ratios of blue light–grown wild-type and hy5 seedlings; lane 5, expression ratios of red light–grown wild-type and hy5 seedlings.
Figure 6.
Figure 6.
Comparison of the Morphology and Genome Expression Profiles of Three Representative cop1 Mutants and the Wild Type under Continuous White, Far-Red, Red, or Blue Light. (A) Continuous white light–grown wild-type and three cop1 mutant Arabidopsis seedlings. D, darkness; WL, white light; WT, wild-type seedlings. Bar = 1 mm. (B) Wild-type and cop1-6 mutant Arabidopsis seedlings grown under continuous blue, red, and far-red light. In each panel, the wild-type seedling is shown at left and the cop1-6 mutant seedling is shown at right. (C) Hierarchical clustering display of expression profiles for the wild type and three representative cop1 mutants under white light. Differential expression ratios are shown for wild-type seedlings grown under white light and dark-grown seedlings (lane 1), white light–grown cop1-4 and wild-type seedlings (lane 2), white light–grown cop1-1 and wild-type seedlings (lane 3), and white light–grown cop1-6 and wild-type seedlings (lane 4). Only those genes that exhibited threefold or greater differential expression in at least one cop1 mutant were included for comparison. A total of 49 genes were included in the cluster. (D) Hierarchical clustering display of expression ratios from light-grown cop1-6 mutant and wild-type seedlings. Differential expression ratios of selected genes are shown for blue light–grown cop1-6 mutant and wild-type seedlings (lane 1), red light–grown cop1-6 mutant and wild-type seedlings (lane 2), far-red light–grown cop1-6 mutant and wild-type seedlings (lane 3), and dark-grown cop1-6 mutant and wild-type seedlings (lane 4). Only those genes that exhibited threefold or greater differential expression in at least three light quality conditions were selected for comparison. A total of 77 genes were included in the cluster. All seedlings shown in (A) and (B) were 6 days old and photographed at the same magnification. The color scale for (C) and (D) is shown at bottom of (B). The dendrograms at top in (C) and (D) indicate the relationship among those data sets across all of the genes included in the clustering analyses.

Similar articles

Cited by

References

    1. Ang, L.H., Chattopadhyay, S., Wei, N., Oyama, T., Okada, K., Batschauer, A., and Deng, X.W. (1998). Molecular interaction between COP1 and HY5 defines a regulatory switch for light control of Arabidopsis development. Mol. Cell 1, 213–222. - PubMed
    1. Ang, L.H., and Deng, X.W. (1994). Regulatory hierarchy of photomorphogenic loci: Allele-specific and light-dependent interaction between the HY5 and COP1 loci. Plant Cell 6, 613–628. - PMC - PubMed
    1. Arabidopsis Genome Initiative. (2000). Analysis of the genome sequence of the flowering plant Arabidopsis thaliana. Nature 408, 796–815. - PubMed
    1. Castle, L., and Meinke, D. (1994). A FUSCA gene of Arabidopsis encodes a novel protein essential for plant development. Plant Cell 6, 25–41. - PMC - PubMed
    1. Chattopadhyay, S., Ang, L.H., Puente, P., Deng, X.W., and Wei, N. (1998). Arabidopsis bZIP protein HY5 directly interacts with light-responsive promoters in mediating light control of gene expression. Plant Cell 10, 673–683. - PMC - PubMed

Publication types

MeSH terms

LinkOut - more resources