. 2002 Oct;14(10):2481-94.
doi: 10.1105/tpc.004747.

Expression profile analysis of the low-oxygen response in Arabidopsis root cultures

Affiliations

Expression profile analysis of the low-oxygen response in Arabidopsis root cultures

Erik Jan Klok et al. Plant Cell. 2002 Oct.

Abstract

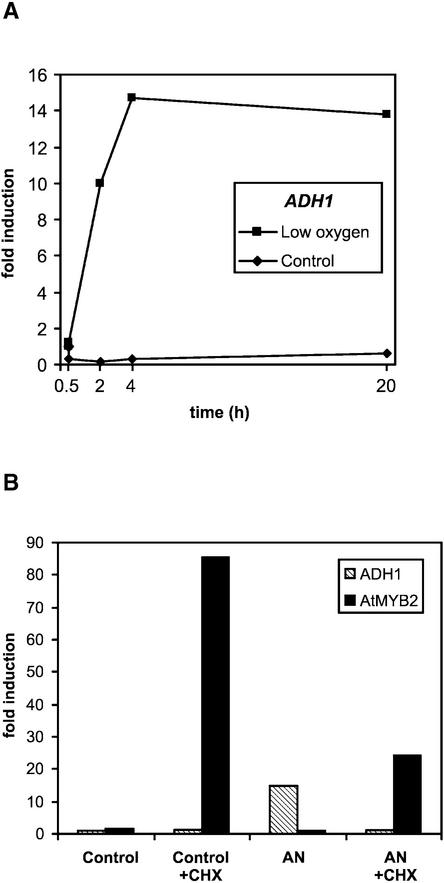
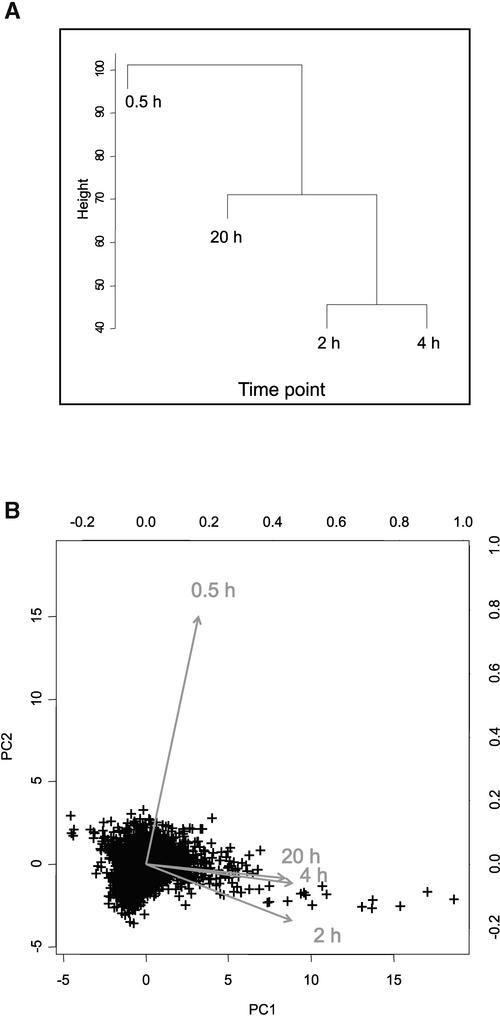
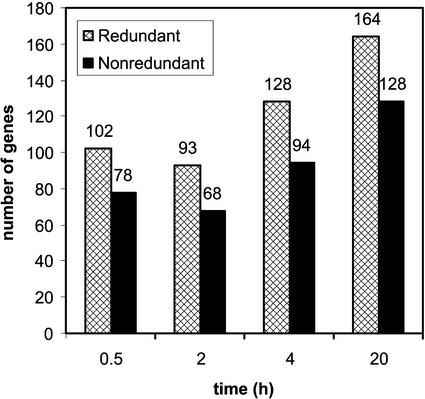
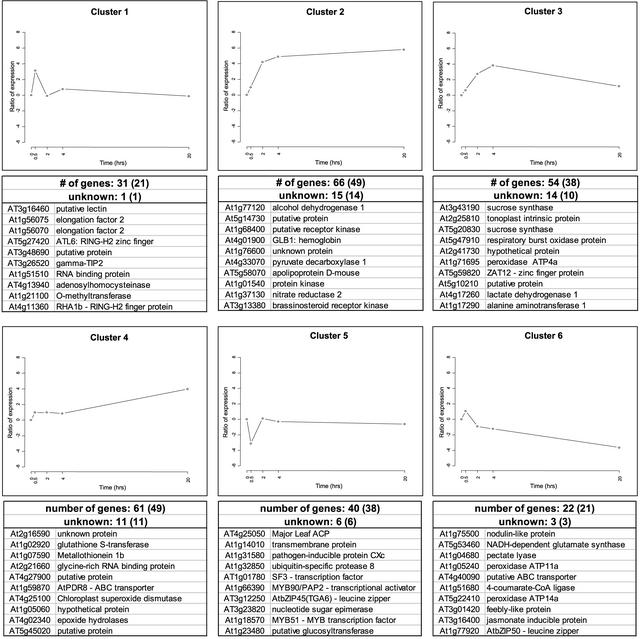
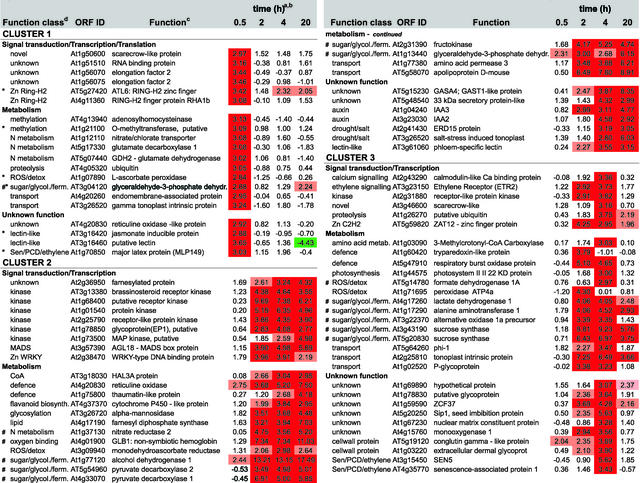
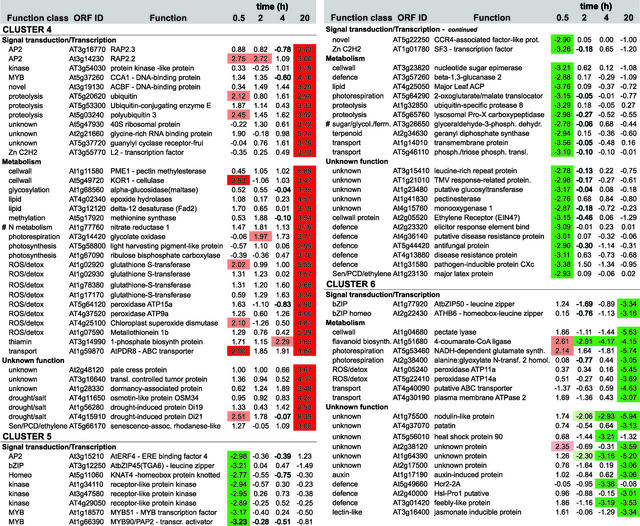
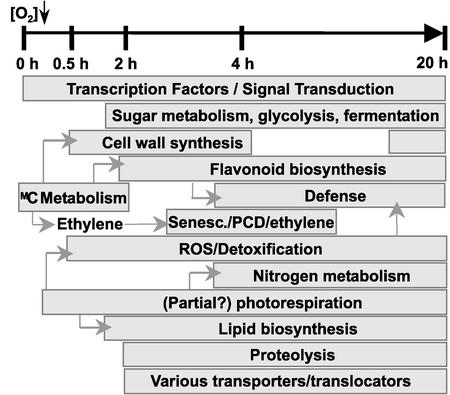
We used DNA microarray technology to identify genes involved in the low-oxygen response of Arabidopsis root cultures. A microarray containing 3500 cDNA clones was screened with cDNA samples taken at various times (0.5, 2, 4, and 20 h) after transfer to low-oxygen conditions. A package of statistical tools identified 210 differentially expressed genes over the four time points. Principal component analysis showed the 0.5-h response to contain a substantially different set of genes from those regulated differentially at the other three time points. The differentially expressed genes included the known anaerobic proteins as well as transcription factors, signal transduction components, and genes that encode enzymes of pathways not known previously to be involved in low-oxygen metabolism. We found that the regulatory regions of genes with a similar expression profile contained similar sequence motifs, suggesting the coordinated transcriptional control of groups of genes by common sets of regulatory factors.


Figures

Figure 1.
Figure 1.
Gene Expression of ADH1 and AtMYB2 under Low-Oxygen Stress. (A) ADH1 mRNA profiles in low-oxygen-treated and control Arabidopsis root cultures. (B) Effect of cycloheximide (CHX) on ADH1 and AtMYB2 mRNA levels in root cultures after 4 h of low-oxygen (5%) treatment (AN), as indicated (10 μM cycloheximide, 2 h before and during low-oxygen treatment). RNA gel blot analyses and quantitation of hybridization signals were performed as described previously (Dolferus et al., 1994). A ubiquitin probe was used to correct for gel-loading differences.
Figure 2.
Figure 2.
The Low-Oxygen Response Consists of Different Stages. Data from the first time point (0.5 h) are not correlated with data from the other three time points. (A) Dendrogram of relationships between data from the four time points (averaged for each gene) as determined by cluster analysis. (B) Principal component analysis (PC1 and PC2) of the data from the four time points (averaged for each gene). The data are presented as a biplot, incorporating the gene effects (scores) as points and the treatments (loadings) as vectors (Gabriel, 1971; Chapman et al., 2002). Vectors that are close together are highly correlated in terms of the gene effects observed for each treatment, whereas vectors that are orthogonal are poorly correlated. Points (genes) that are near the origin of the biplot are either not expressed differentially in all treatments or are explained poorly by the principal component analysis. Points (genes) that are close to the head of a vector have high positive expression values in that treatment, whereas genes on the opposite side of the origin, relative to the head of the vector, have negative expression values for that treatment. The relative expression level of any combination of gene and treatment can be determined by a perpendicular projection of a point onto a vector.
Figure 3.
Figure 3.
Differential Gene Expression under Low-Oxygen Stress. The total number of differentially expressed genes in both the redundant and nonredundant sets in each time point of the low-oxygen time course is shown. Note that genes can be expressed differentially in more than one time point.
Figure 4.
Figure 4.
Expression Profiles of Genes Expressed Differentially under Low-Oxygen Stress. The graphs represent the means of expression for each cluster (see Figure 5). The y axis is in log base 2 units. The total number of genes and the number of unknown genes is indicated, with the number of nonredundant genes shown in parentheses. For each expression profile, the 10 most highly induced or repressed genes are listed with both open reading frame identifiers and functions. The complete list of differentially expressed genes is available in the supplemental data online.
Figure 5.
Figure 5.
Expression Profiling and Functional Clustering of Genes Differentially Expressed by Low-Oxygen Stress. Genes with differential expression pattern under low oxygen conditions are grouped in 6 clusters according to their induction profile. Values in the table are ratios of low-oxygen treated compared to aerated roots for the time given, and are transformed (log base 2, so ratio = 2n) and normalised. Positive values indicate induction, whereas negative values indicate repression. High induction is shaded in red, high repression in green; levels of differential induction are indicated by pale red (1.96>n>2.75) and dark red (n>2.75), and the same applies for the levels of repression as indicated by the green colours. Clones from unknown, putative, or hypothetical proteins are not shown, nor are redundant clones. The complete list, including unknown and redundant clones, Genbank accession numbers, clone IDs, gene descriptions, and literature references can be found via the online version of this publication. Known ANPs (#) and transition proteins (*) are indicated.
Figure 5.
Figure 5.
Expression Profiling and Functional Clustering of Genes Differentially Expressed by Low-Oxygen Stress. Genes with differential expression pattern under low oxygen conditions are grouped in 6 clusters according to their induction profile. Values in the table are ratios of low-oxygen treated compared to aerated roots for the time given, and are transformed (log base 2, so ratio = 2n) and normalised. Positive values indicate induction, whereas negative values indicate repression. High induction is shaded in red, high repression in green; levels of differential induction are indicated by pale red (1.96>n>2.75) and dark red (n>2.75), and the same applies for the levels of repression as indicated by the green colours. Clones from unknown, putative, or hypothetical proteins are not shown, nor are redundant clones. The complete list, including unknown and redundant clones, Genbank accession numbers, clone IDs, gene descriptions, and literature references can be found via the online version of this publication. Known ANPs (#) and transition proteins (*) are indicated.
Figure 6.
Figure 6.
Scheme of the Different Biochemical Processes Induced under Low-Oxygen Stress during the 20-h Treatment Period. PCD, programmed cell death; ROS, reactive oxygen species.

References

    1. Armstrong, W. (1979). Aeration in higher plants. Adv. Bot. Res. 7, 225–232.
    1. Bailey-Serres, J., and Freeling, M. (1990). Hypoxic stress-induced changes in ribosomes of maize seedling roots. Plant Physiol. 94, 1237–1243. - PMC - PubMed
    1. Borsani, O., Cuartero, J., Fernandez, J.A., Valpuesta, V., and Botella, M.A. (2001). Identification of two loci in tomato reveals distinct mechanisms for salt tolerance. Plant Cell 13, 873–888. - PMC - PubMed
    1. Chang, W.W., Huang, L., Shen, M., Webster, C., Burlingame, A.L., and Roberts, J.K. (2000). Patterns of protein synthesis and tolerance of anoxia in root tips of maize seedlings acclimated to a low-oxygen environment, and identification of proteins by mass spectrometry. Plant Physiol. 122, 295–318. - PMC - PubMed
    1. Chapman, S.C., Schenk, P., Kazan, K., and Manners, J.M. (2002). Using biplots to interpret gene expression patterns in plants. Bioinformatics 18, 202–204. - PubMed

MeSH terms