Comparative Study
. 2002 Oct;14(10):2577-90.
doi: 10.1105/tpc.004259.

QUASIMODO1 encodes a putative membrane-bound glycosyltransferase required for normal pectin synthesis and cell adhesion in Arabidopsis

Affiliations
Comparative Study

QUASIMODO1 encodes a putative membrane-bound glycosyltransferase required for normal pectin synthesis and cell adhesion in Arabidopsis

Sophie Bouton et al. Plant Cell. 2002 Oct.

Abstract

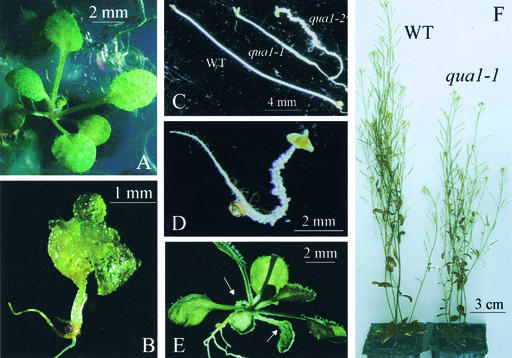
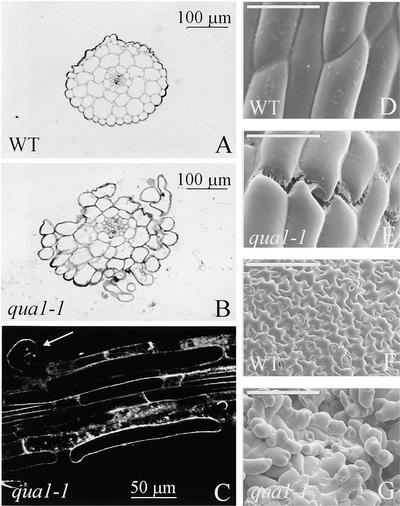
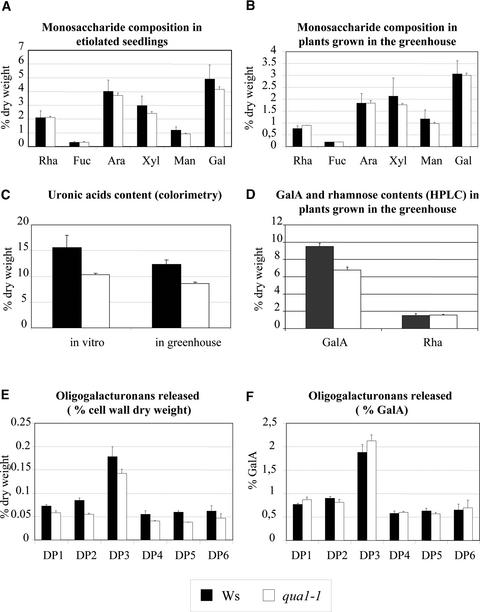
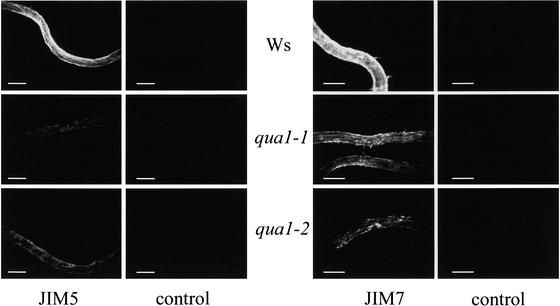
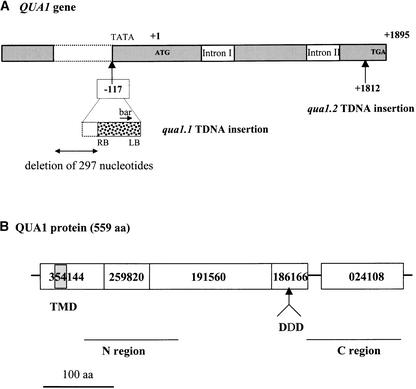
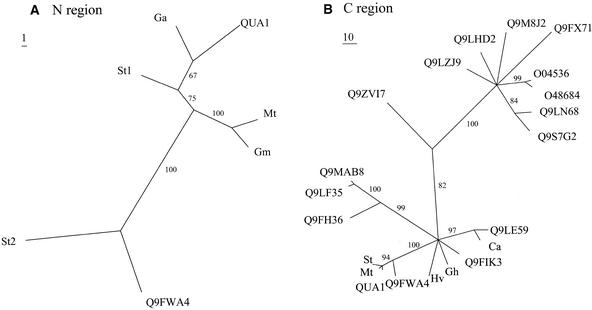
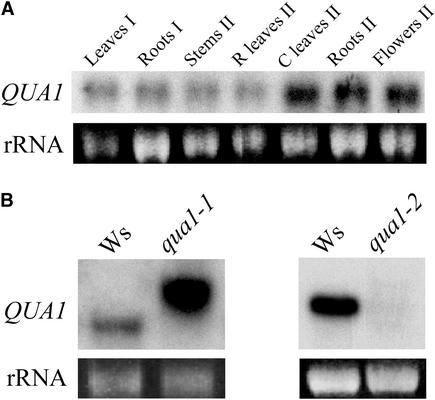
Pectins are a highly complex family of cell wall polysaccharides. As a result of a lack of specific mutants, it has been difficult to study the biosynthesis of pectins and their role in vivo. We have isolated two allelic mutants, named quasimodo1 (qua1-1 and qua1-2), that are dwarfed and show reduced cell adhesion. Mutant cell walls showed a 25% reduction in galacturonic acid levels compared with the wild type, indicating reduced pectin content, whereas neutral sugars remained unchanged. Immersion immunofluorescence with the JIM5 and JIM7 monoclonal antibodies that recognize homogalacturonan epitopes revealed less labeling of mutant roots compared with the wild type. Both mutants carry a T-DNA insertion in a gene (QUA1) that encodes a putative membrane-bound glycosyltransferase of family 8. We present evidence for the possible involvement of a glycosyltransferase of this family in the synthesis of pectic polysaccharides, suggesting that other members of this large multigene family in Arabidopsis also may be important for pectin biosynthesis. The mutant phenotype is consistent with a central role for pectins in cell adhesion.


Figures

Figure 1.
Figure 1.
Phenotypes of the qua1-1 and qua1-2 Mutants Grown in Vitro or in the Greenhouse. (A) Wild-type plant grown in vitro for 17 days in a 16-h-light/8-h-dark regime. (B) qua1-1 mutant with a severe phenotype grown in vitro for 17 days in a 16-h-light/8-h-dark regime. The qua1-2 mutant displayed the same morphology as the qua1-1 mutant shown here. (C) Phenotype of the wild type (WT) and qua1-1 and qua1-2 mutants grown for 7 days in vitro in the dark in the absence of sugar. (D) Close-up view of the qua1-2 mutant grown for 7 days in vitro in the dark. (E) Phenotype of a qua1-1 mutant that displays an almost wild-type morphology except for the protuberances (arrows) on the cotyledons. This phenotype is never observed for the qua1-2 mutant. (F) Wild-type and qua1-1 mutant plants grown in the greenhouse.
Figure 2.
Figure 2.
Structural Analyses of the Wild Type and qua1-1 Mutants. (A) and (B) Cross-sections of the hypocotyls of wild-type (WT) and qua1-1 mutant plants stained with methylene blue after 7 days of growth in the dark in vitro in the absence of sugar. (C) Loss of cell adhesion in roots of the qua1-1 mutant. Roots of 2-week-old plants grown in vitro with a 16-h-light/8-h-dark regime were stained with FM4-64 and visualized with a confocal microscope. The arrow indicates an epidermal cell that is partially detached from the roots. (D) to (G) Scanning electron micrographs of wild-type and qua1-1 epidermal cells from hypocotyls ([D] and [E]) or leaves ([F] and [G]). Plants were grown for 2 weeks in vitro with a 16-h-light/8-h-dark regime before analysis. Bars = 50 μm ([D] and [E]) or 100 μm ([F] and [G]).
Figure 3.
Figure 3.
Dehydration of Rosette Leaves of Wild-Type (Wassilewskija [Ws]) and qua1-1 Plants Grown in the Greenhouse. Rosette leaves of 1-month-old plants were collected, and their fresh weight was determined at different time intervals (time 0 is immediately after the transfer of the leaves in the hood). Four independent samples of three plants were used for each genotype. Bars indicate the standard error for each data point. For wild-type plants, the standard error was at most equal to 1.6%; therefore, the bars do not appear in the graph.
Figure 4.
Figure 4.
Chemical Analyses of the Cell Walls of Wild-Type and qua1-1 Mutant Plants. (A) and (B) Monosaccharide composition of wild-type (Wassilewskija [Ws]) and qua1-1 mutant cell walls grown in vitro in the dark (A) or in the greenhouse (B). Results are expressed as a percentage of cell wall dry weight. Plants were grown in vitro in the absence of sugar for 7 days in the dark or in the greenhouse for 1 month. Cell walls were prepared from total plant material (in vitro) or from rosette leaves (in the greenhouse). Bars indicate standard errors (n = 3). Similar results were obtained in another independent experiment (data not shown). Rha, rhamnose; Fuc, fucose; Ara, arabinose; Xyl, xylose; Man, mannose; Gal, galactose. (C) Uronic acid content determined by colorimetry in wild-type and qua1-1 mutant cell walls grown in vitro in the dark or in the greenhouse. Results are expressed as a percentage of cell wall dry weight. Plants were grown in vitro in the absence of sugar for 7 days in the dark or in the greenhouse for 1 month. Cell walls were prepared from total plant material (in vitro) or from rosette leaves (in the greenhouse). Bars indicate standard errors (n = 3). Similar results were obtained in another independent experiment (data not shown). (D) GalA and rhamnose contents determined by HPLC after methanolysis in the wild type and the qua1-1 mutant. Plants were grown for 1 month in the greenhouse. Results are expressed as a percentage of cell wall dry weight. Bars indicate standard errors (n = 4). (E) Oligogalacturonans (DP1 to DP6) released by an endopolygalacturonase from wild-type and qua1-1 mutant cell walls. Results are expressed as a percentage of cell wall dry weight. Cell walls were prepared from rosette leaves of plants grown in the greenhouse for 1 month. Bars indicate standard errors (n = 3). (F) Oligogalacturonans (DP1 to DP6) released by an endopolygalacturonase from wild-type and qua1-1 mutant cell walls. Results are expressed as a percentage of GalA. Cell walls were prepared from rosette leaves of plants grown in the greenhouse for 1 month. Bars indicate standard errors (n = 3).
Figure 5.
Figure 5.
Immersion Immunofluorescence of Wild-Type, qua1-1, and qua1-2 Roots Incubated with the Monoclonal Antibodies JIM5 and JIM7. Roots of 6-day-old seedlings grown in vitro in a 16-h-light/8-h-dark regime were incubated with either the JIM5 or the JIM7 monoclonal antibody. After washes and incubation with a secondary fluorescein isothiocyanate–coupled antibody, roots were visualized with a microscope coupled to a charge-coupled device camera. Negative controls refer to roots incubated with the secondary antibody without previous exposure to the JIM5 or the JIM7 antibody. All images were recorded with the same settings (light intensity, filters, and camera settings) for wild-type, mutant, and background control samples. Ws, Wassilewskija. Bars = 200 μm.
Figure 6.
Figure 6.
Structures of the QUA1 Gene and the QUA1 Protein. (A) QUA1 gene structure and insertion sites of the T-DNAs in the qua1-1 and qua1-2 mutants. Numbers indicate the insertion sites of the T-DNAs (+1 being the A of the initiator ATG, +1895 being the A of the stop codon TGA). bar, Basta resistance gene; LB, left border of the T-DNA; RB, right border of the T-DNA; TATA, potential TATA box. (B) QUA1 protein domains. ProDom protein domains of QUA1 are designated by their numbers. The ProDom 186166 domain is common to the members of the glycosyltransferase family 8 defined by Campbell et al. (1997) and contains the conserved DXD motif (DDD in QUA1). The gray box indicates the predicted transmembrane domain of QUA1. N and C regions indicate the regions of QUA1 that were used to build the phylogenetic trees in Figure 7. aa, amino acids.
Figure 7.
Figure 7.
Phylogenetic Analysis of QUA1 and Homologous Proteins from Arabidopsis or Potentially Encoded by ESTs from Other Plant Species. (A) Phylogenetic consensus tree using a 150–amino acid region that lies at the N-terminal end of QUA1 (amino acids 58 to 206). Bootstrap values >50% are shown. Homologous proteins used to build the tree are the Arabidopsis Q9FWA4 protein and potential proteins encoded by ESTs from Gossypium arboreum (Ga), Medicago truncatula (Mt), Glycine max (Gm), and Solanum tuberosum (St). (B) Phylogenetic consensus tree using a 150–amino acid region that lies at the C-terminal end of QUA1 (amino acids 403 to 544). Bootstrap values >50% are shown. Homologous proteins used to build the tree are the Arabidopsis Q9FH36, Q9LF35, Q9MAB8, Q9FWA4, Q9FIK3, Q9LE59, O48684, O04536, Q9FX71, Q9M8J2, Q9LHD2, and Q9LZJ9 proteins and potential proteins encoded by ESTs or cDNAs from S. tuberosum (St), M. truncatula (Mt), Hordeum vulgare (Hv), Gossypium hirsutum (Gh), and Cicer arietinum (Ca). See Methods.
Figure 8.
Figure 8.
RNA Gel Blot Analysis of QUA1 Expression. (A) QUA1 expression in organs from wild-type plants grown in the greenhouse at the vegetative stage (I) or after floral induction (II). A total of 5 μg of RNAs was loaded in each lane. 25S rRNA fluorescence is shown as a control for lane loading. (B) QUA1 mRNA levels were analyzed in wild-type (Wassilewskija [Ws]) and mutant (qua1-1 and qua1-2) plants grown in vitro for 2 weeks in a 16-h-light/8-h-dark regime. A total of 5 μg of RNAs was loaded in each lane. 25S rRNA fluorescence is shown as a control for lane loading.

References

    1. Altschul, S.F., Gish, W., Miller, W., Myers, E.W., and Lipman, D.J. (1990). Basic local alignment search tool. J. Mol. Biol. 215, 403–410. - PubMed
    1. Benen, J.A.E., Kester, H.C.M., and Visser, J. (1999). Kinetic characterization of Aspergillus niger N400 endopolygalacturonases I, II and C. Eur. J. Biochem. 259, 577–585. - PubMed
    1. Bouchez, D., Camilleri, C., and Caboche, M. (1993). A binary vector based on Basta resistance for in planta transformation of Arabidopsis thaliana. C. R. Acad. Sci. Paris 316, 1188–1193.
    1. Burton, R.A., Gibeaut, D.M., Bacic, A., Findlay, K., Roberts, K., Hamilton, A., Baulcombe, D.C., and Fincher, G.B. (2000). Virus-induced silencing of a plant cellulose synthase gene. Plant Cell 12, 691–705. - PMC - PubMed
    1. Campbell, J.A., Davies, G.J., Bulone, V., and Henrissat, B. (1997). A classification of nucleotide-diphospho-sugar glycosyltransferases based on amino acid sequence similarities. Biochem. J. 326, 929–942. - PMC - PubMed

Publication types

MeSH terms