. 2002 Oct 7;196(7):957-68.
doi: 10.1084/jem.20021052.

CD4 effector T cell subsets in the response to influenza: heterogeneity, migration, and function

Affiliations

CD4 effector T cell subsets in the response to influenza: heterogeneity, migration, and function

Eulogia Román et al. J Exp Med. .

Abstract

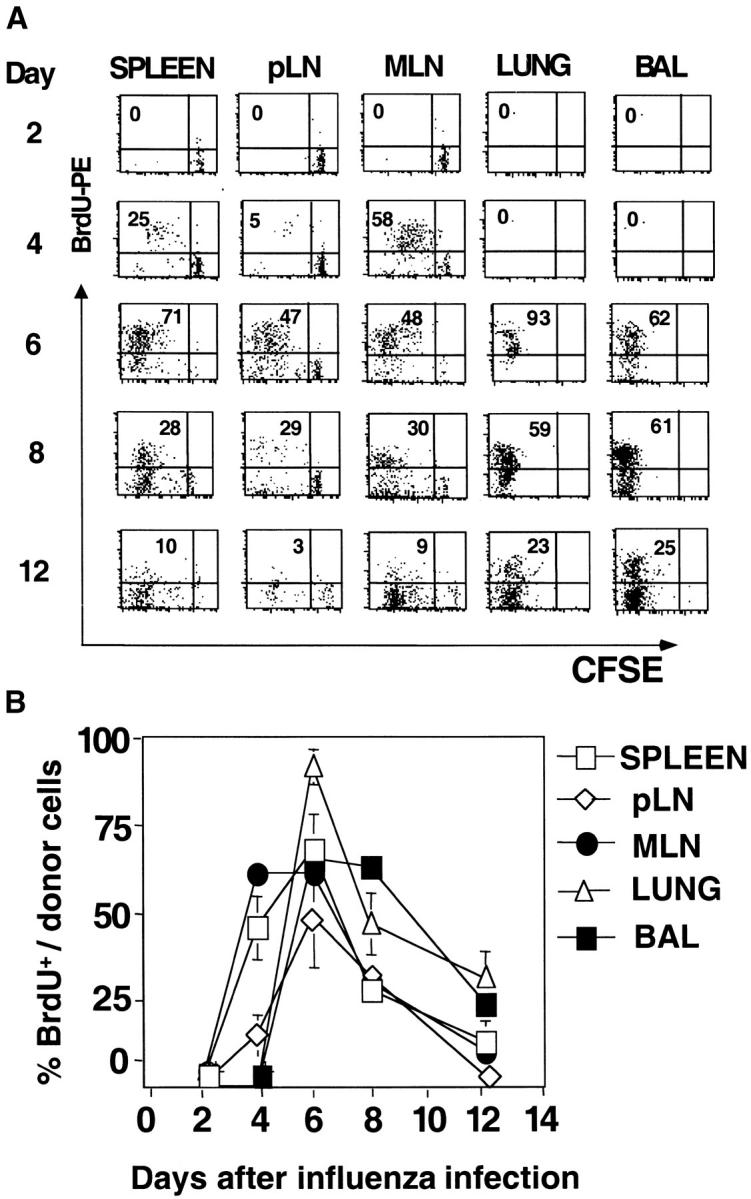
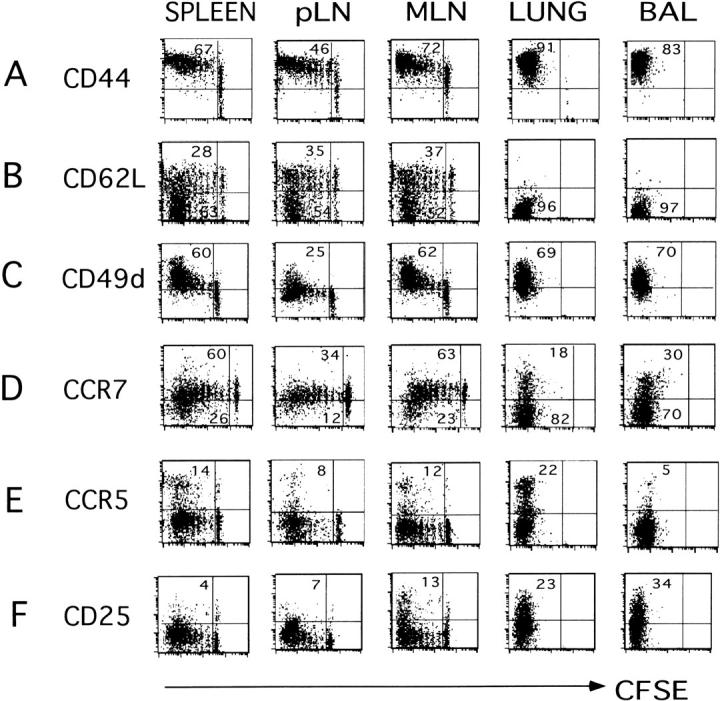
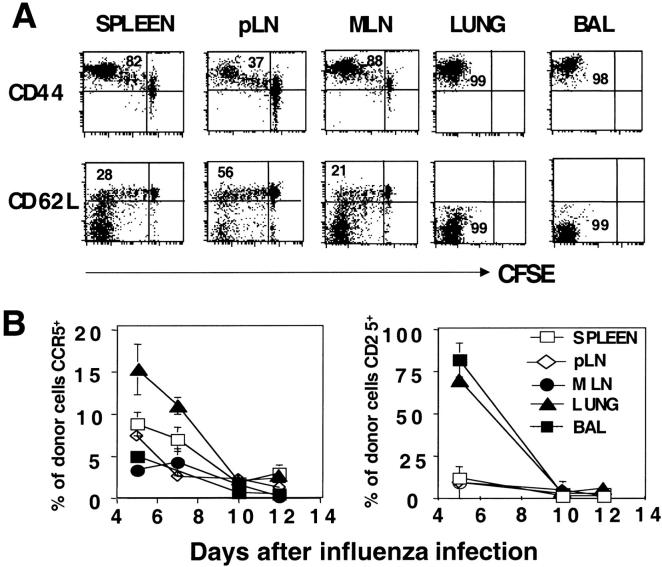
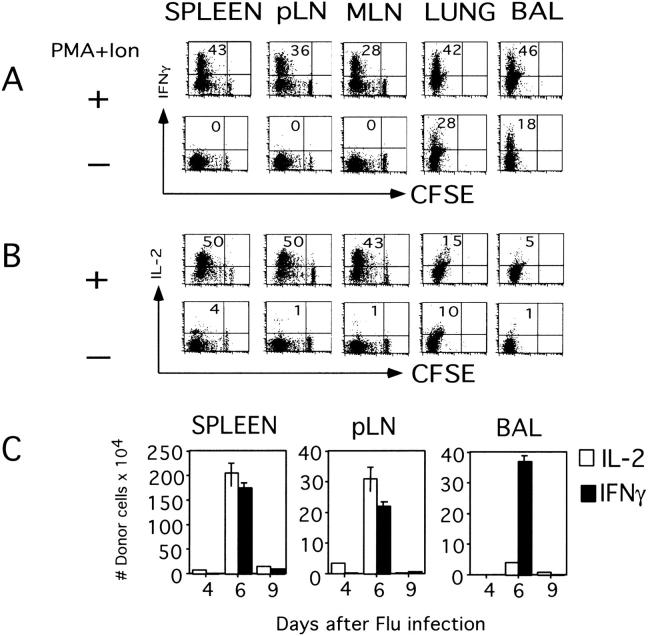
The immune response of naive CD4 T cells to influenza virus is initiated in the draining lymph nodes and spleen, and only after effectors are generated do antigen-specific cells migrate to the lung which is the site of infection. The effector cells generated in secondary organs appear as multiple subsets which are a heterogeneous continuum of cells in terms of number of cell divisions, phenotype and function. The effector cells that migrate to the lung constitute the more differentiated of the total responding population, characterized by many cell divisions, loss of CD62L, down-regulation of CCR7, stable expression of CD44 and CD49d, and transient expression of CCR5 and CD25. These cells also secrete high levels of interferon gamma and reduced levels of interleukin 2 relative to those in the secondary lymphoid organs. The response declines rapidly in parallel with viral clearance, but a spectrum of resting cell subsets reflecting the pattern at the peak of response is retained, suggesting that heterogeneous effector populations may give rise to corresponding memory populations. These results reveal a complex response, not an all-or-none one, which results in multiple effector phenotypes and implies that effector cells and the memory cells derived from them can display a broad spectrum of functional potentials.


Figures

Figure 1.
Figure 1.
Kinetics of expansion and recruitment of in vivo generated effectors. 5 × 10⁶ naive CFSE-labeled, CD4 T cells from HNT.Thy1.1 mice, were transferred into normal BALB/c hosts. Recipient mice were infected intranasally with 0.5 LD50 of A/PR8/34 (PR8, H1N1) influenza A virus 1 d later. At the indicated time points after infection, mice were killed and spleen, a pool of nondraining LN (pLN), MLN, lungs, and BAL were harvested. The total number of cells and percentage of CD4+Thy1.1+ (donor cells) was calculated. (A) Absolute cell numbers of donor cells in the organs indicated over time after influenza infection calculated using the percentages in B. Each bar represents three individual mice per group and is representative of three independent experiments. (B) The percentages of donor cells obtained from each organ. (C) The virus titer in the lungs of BALB/c mice from day 2 to 8. Data represent mean titers from lungs of three individual mice analyzed per time point.
Figure 2.
Figure 2.
Kinetics of division of donor CD4 T cells. Infected recipient mice were generated as in Fig. 1. BrdU incorporation was analyzed at 48 h intervals, starting immediately after influenza infection up to day 12. Each group of mice was fed orally for 2 d. On days 2, 4, 6, and 8 mice were killed and tissue processed as described. (A) Kinetics of cell division, dot plots of BrdU incorporation and CFSE profiles in the indicated organs gated on CD4+ Thy1.1+ cells. The numbers in the top left quadrant indicate the percentages of donor T cells that incorporated BrdU over a 48-h period. Data are representative of three mice per group and two independent experiments. (B) Percentages of BrdU+ donor cells at the time points indicated.
Figure 3.
Figure 3.
Phenotype of responding donor cells in different sites infected recipient mice were generated as in Fig. 1. After 6 d, cell suspensions from spleen, pLN, MLN, lung, and BAL were prepared and donor cells were identified by staining with anti-Thy1.1-Biotin followed by streptavidin-APC and anti-CD4-Cychrome. Expression of activation markers and CFSE fluorescence of gated donor cells was analyzed. Markers were: (A) CD44-PE, (B) CD62L-PE, (C) CD49d-PE, (D) CCR7, detected using the ELC-Ig chimera followed by anti–human-APC, (E) CCR5-PE, and (F) CD25-PE. Quadrants were set relative to isotype controls. The numbers in the top and bottom left quadrants indicate the percentages of cells expressing the indicated marker. Three individual mice were analyzed in each experiment, all were similar, one is shown. Data are representative two different experiments.
Figure 4.
Figure 4.
Phenotypic heterogeneity after the acute phase of the immune response infected recipient mice were prepared as in Figs. 1–3 and harvested at various days up to day 15. Donor cells, CFSE, and phenotypic markers were identified as in Fig. 3. (A) Expression of CD44 and CD62L on gated donor cells versus CFSE fluorescence on organs harvested 15 d after influenza virus infection. (B) Kinetics of expression of CCR5 and CD25 at indicated days after influenza infection. Percentages of donor cells expressing CCR5 and CD25 based on the total cell number obtained per organ. Each point represents the mean of three mice per group.
Figure 5.
Figure 5.
Cytokine production by responding donor cells. Infected recipient mice were prepared as in Fig. 3. At day 6, donor cells in spleen, a pool of nondraining (pLN), MLN, lung, and BAL were analyzed for their capacity to produce cytokines in vitro after restimulation with and without PMA and Ionomycin for 4 h in the presence of BFA for the last 2 h. (A) IFN-γ–producing cells gated on donor cells. (B) IL-2–producing cells gated on donor cells. (C) Kinetic analysis of absolute numbers of donor cells expressing the indicated cytokine at different days after influenza infection.

References

    1. Jenkins, M.K., A. Khoruts, E. Ingulli, D.L. Mueller, J.S. McSorley, R.L. Reinhardt, A. Itano, and K.A. Pape. 2001. In vivo activation of antigen-specific CD4 T cells. Annu. Rev. Immunol. 19:23–45. - PubMed
    1. Mercado, R., S. Vijh, S.E. Allen, K. Kerksiek, I.M. Pilip, and E.G. Pamer. 2000. Early programming of T cell populations responding to bacterial infection. J. Immunol. 165:6833–6839. - PubMed
    1. Van Stipdonk, M.J.B., E.E. Lemmens, and S.P. Schoenberger. 2001. Naive CTLs require a single brief period of antigenic stimulation for clonal expansion and differentiation. Nat. Immunol. 2:423–429. - PubMed
    1. Kaech, S.M., and R. Ahmed. 2001. Memory CD8+ T cell differentiation: initial antigen encounter triggers a developmental program in naive cells. Nat. Immunol. 2:415–422. - PMC - PubMed
    1. Laouar, Y., and I.N. Crispe. 2000. Functional flexibility in T cells: Independent regulation of CD4+ T cell proliferation and effector function in vivo. Immunity. 13:291–301. - PubMed

Publication types

MeSH terms