. 2002 Oct 7;196(7):979-90.
doi: 10.1084/jem.20020619.

A point mutation of Tyr-759 in interleukin 6 family cytokine receptor subunit gp130 causes autoimmune arthritis

Affiliations

A point mutation of Tyr-759 in interleukin 6 family cytokine receptor subunit gp130 causes autoimmune arthritis

Toru Atsumi et al. J Exp Med. .

Abstract

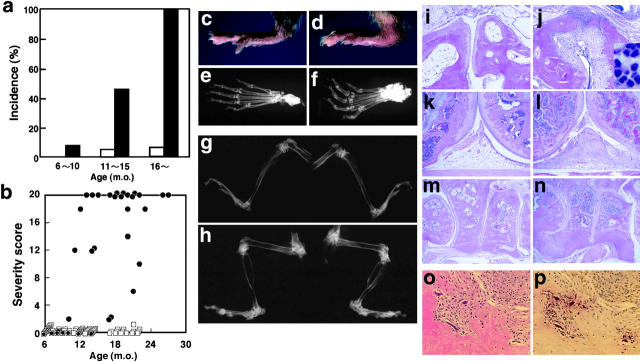
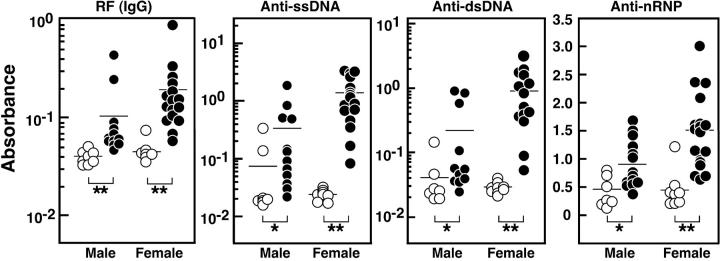
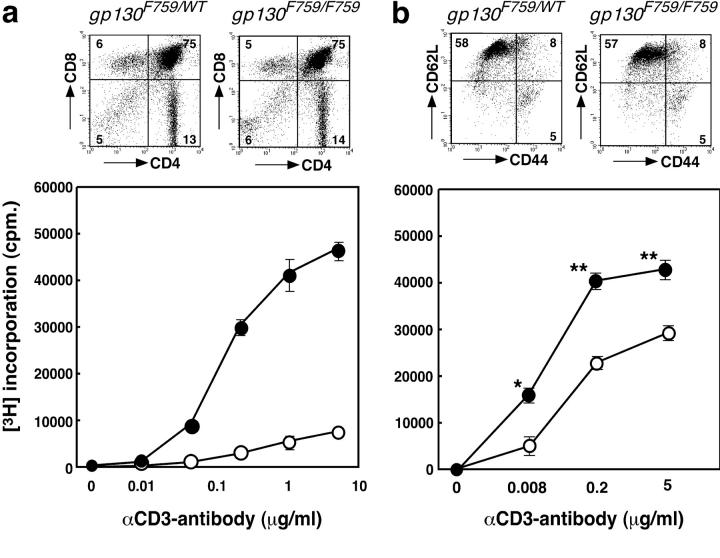
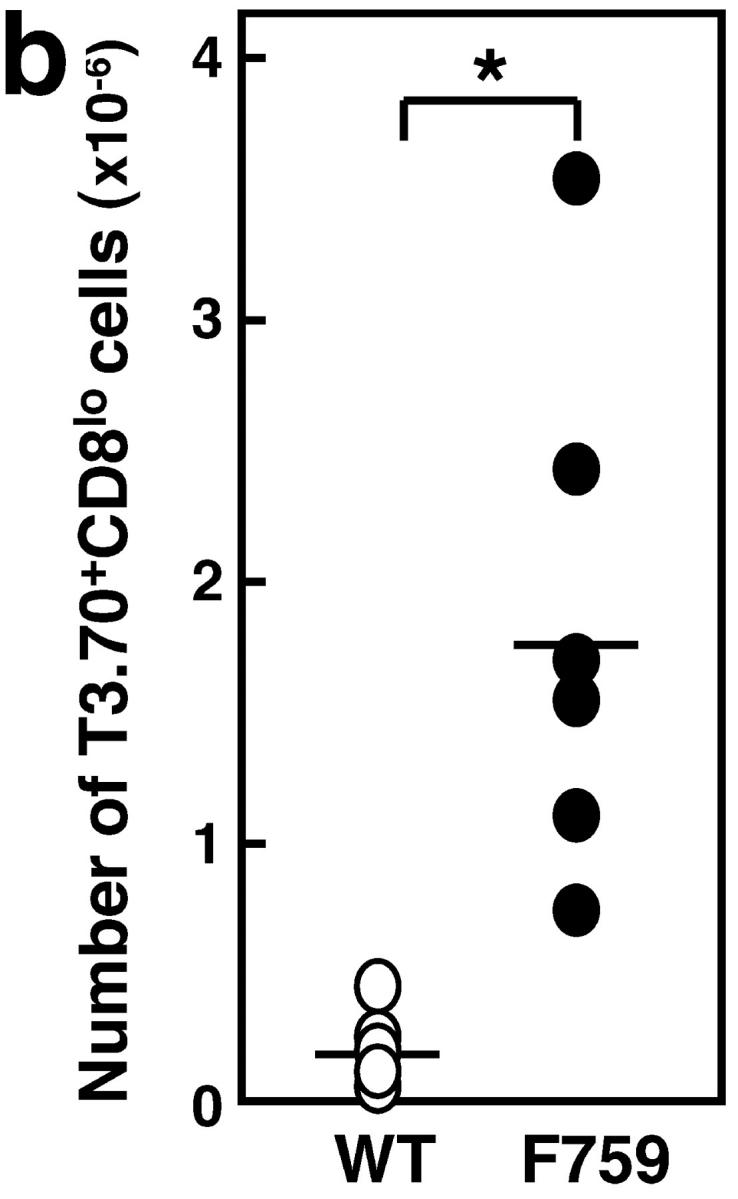
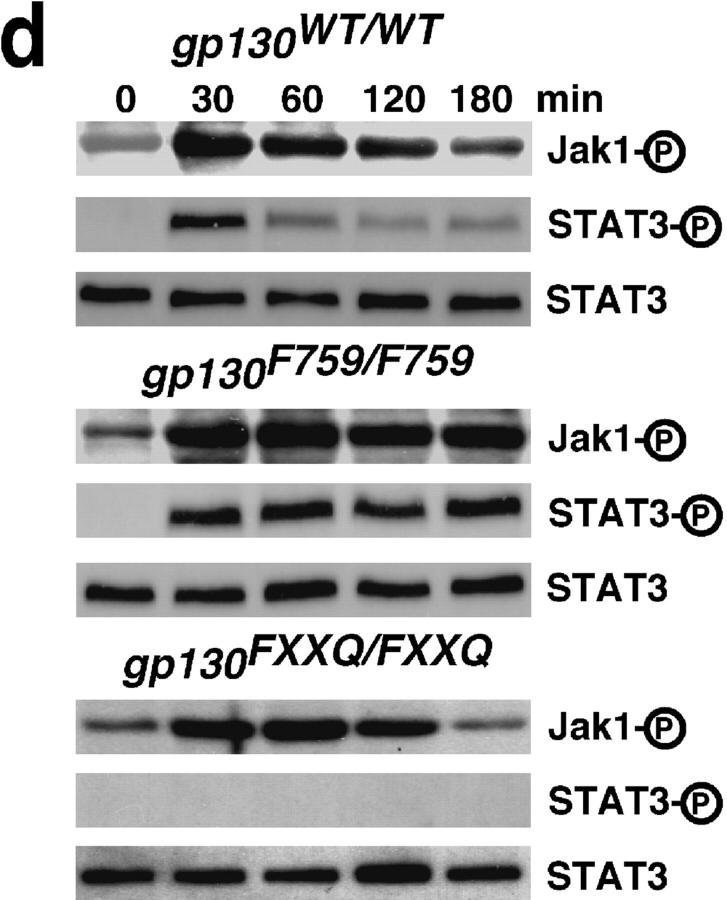
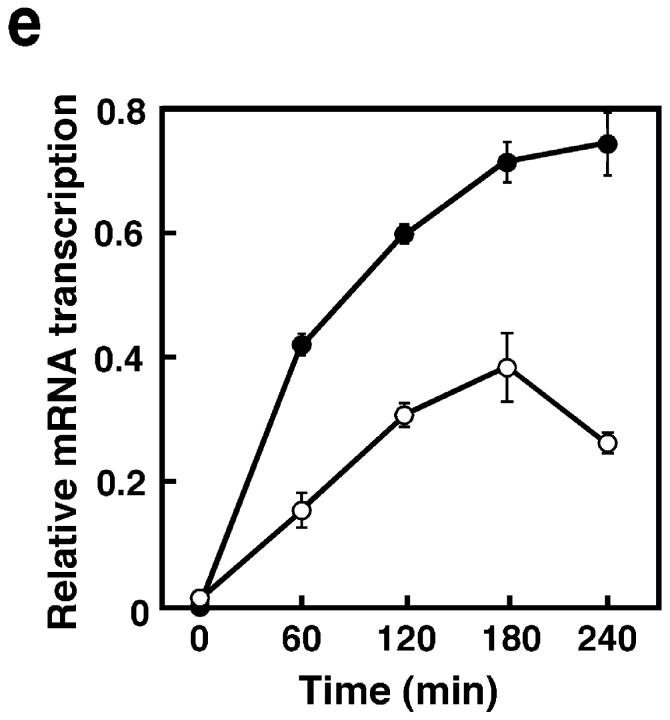
We generated a mouse line in which the src homology 2 domain-bearing protein tyrosine phosphatase (SHP)-2 binding site of gp130, tyrosine 759, was mutated to phenylalanine (gp130(F759/F759)). The gp130(F759/F759) mice developed rheumatoid arthritis (RA)-like joint disease. The disease was accompanied by autoantibody production and accumulated memory/activated T cells and myeloid cells. Before the disease onset, the T cells were hyperresponsive and thymic selection and peripheral clonal deletion were impaired. The inhibitory effect of IL-6 on Fas ligand expression during activation-induced cell death (AICD) was augmented in gp130(F759/F759) T cells in a manner dependent on the tyrosine residues of gp130 required for signal transducer and activator of transcription 3 activation. Finally, we showed that disease development was dependent on lymphocytes. These results provide evidence that a point mutation of a cytokine receptor has the potential to induce autoimmune disease.


Figures

Figure 1.
Figure 1.
Development of spontaneous arthritis in gp130F759/F759 mice. (a) Incidence of arthritis in gp130 F759/F759 mice of three age groups. Each joint of gp130 WT/WT (male n = 26, female n = 23) and gp130 F759/F759 (male n = 29, female n = 15) mice was regularly examined and the severity was scored according to a set of defined criteria (see Materials and Methods). White and black bars indicate the incidence of arthritis in gp130 WT/WT and gp130 F759/F759 mice of each age group, respectively. (b) Relationship between age and severity of arthritis in gp130 F759/F759 (black circle: male n = 29, female n = 15) and control gp130 WT/WT (white square, male n = 26, female n = 23) mice. (c) Hindlimb of an 11-mo-old gp130 WT/WT mouse. (d) Swelling and redness of the hindlimb of an 11-mo-old gp130 F759/F759 mouse. (e and f) Radiologic analysis of hindlimbs from gp130 WT/WT (e) and gp130 F759/F759 (f) mice. Representative cases (18 mo old) from the radiological analysis of 18 mice with arthritis are shown. (g and h) Control gp130 WT/F759 mouse (g) and ankylosis of the large joints of a gp130 F759/F759 mouse (h) (28 mo old). (i–p) Histological analyses of H&E-stained sections of joints. Ankle joints of gp130 WT/WT (i) and gp130 F759/F759 (j) mice. Inset in (j) shows infiltration of neutrophils in the synovium in larger magnification. Knee joints of gp130 WT/WT (k) and gp130 F759/F759 (l) mice. Ankylotic ankle joint of gp130 F759/F759 (n) mouse, whose X-ray photographs are shown in (h), and a control gp130 WT/F759 (m) mouse. (o) Pannus formation and activated osteoclasts in the ankle joint of a gp130 F759/F759 mouse. (p) TRAP staining of a serial section from the section used in (o) with hematoxylin counter staining. Representative cases from the histological analysis of gp130 F759/F759 mice with arthritis (n = 18) are shown.
Figure 2.
Figure 2.
Autoantibody production in gp130F759/F759 mice. Serum from 11–12-mo-old gp130 F759/F759 mice with arthritis (n = 31; 14 male, 17 female) and their wild-type littermates (n = 16; 8 male, 8 female) was assayed for the levels of autoantibodies by ELISA. White and black circles represent the serum levels of antibody in individual gp130 WT/WT and gp130 F759/F759mouse, respectively. Horizontal bars represent the mean values of each group. Asterisks indicate significant differences by Mann-Whitney U test (*P < 0.05; **P < 0.01).
Figure 3.
Figure 3.
Flow cytometry analysis of lymphoid organs of gp130F759/F759 mice with arthritis. Cells from the thymus and lymph nodes of a gp130 F759/F759 mouse with arthritis and a gp130 F759/WT littermate at 19 mo of age were stained with a combination of antibodies and analyzed as described in Materials and Methods. Dot plots of thymocytes (a and b), total lymph node cells (c), CD4+ (d and e), and CD8+ (f) lymph node cells are shown. The numbers indicate the frequencies of the cell populations in the indicated regions of the dot plots. These are representative data of severe cases from the flow cytometry analysis of gp130 F759/F759 mice with arthritis (n = 27) and control mice (n = 15) at ages from 8 to 30 mo. The results from the gp130 WT/WT mice were similar to those from the gp130 F759/WT mice.
Figure 4.
Figure 4.
Hyperresponsiveness of anti-CD3–stimulated thymocytes and lymph nodes T cells in gp130F759/F759 mice (a) Thymocytes from 12-wk-old gp130 F759/F759 mice without arthritis (black circles) and their littermates (white circles) were cultured for 48 h in the presence of the indicated concentrations of soluble anti-CD3 antibody. Growth responses were measured by 3[H]thymidine incorporation. Error bars indicate the SD of duplicated cultures. Representative data from three independent experiments are shown. The populations of the thymocytes used in this growth assay were analyzed by flow cytometry and dot plots are shown on the top. (b) Lymph node cells from 8-wk-old gp130 F759/F759 mice without arthritis (black circles) and their littermates (white circles) were cultured for 72 h in the presence of the indicated concentrations of soluble anti-CD3 antibody. Error bars indicate the SD of duplicated cultures. Asterisks indicate significant differences by Student's t test (P < 0.05). Expression of markers for memory/activated T cells in the lymph node cells used in this experiment is shown on the top. Representative data from >10 independent experiments are shown.
Figure 5.
Figure 5.
Impaired thymic negative selection in gp130F759/F759 mice. (a) Subpopulations of T3.70+ thymocytes of 8-wk-old anti-HY TCR+ gp130 WT/WT and anti-HY TCR+ gp130 F759/F759 mice are shown in the contour plots. Top and bottom panels show the analysis for female and male mice, respectively. The numbers in the quadrants are the frequencies of the subsets in the T3.70-positive thymocytes. The total cell numbers of thymocytes are indicated on the contour plots. (b) The absolute cell numbers of T3.70+CD8lo thymocytes of male anti-HY TCR+ gp130 WT/WT (white circle), (n = 6) and anti-HY TCR+ gp130 F759/F759 (black circle), (n = 6) mice are shown. Asterisk indicates significant differences by Student's t test (*P < 0.05). Representative data from three independent experiments are shown.
Figure 5.
Figure 5.
Impaired thymic negative selection in gp130F759/F759 mice. (a) Subpopulations of T3.70+ thymocytes of 8-wk-old anti-HY TCR+ gp130 WT/WT and anti-HY TCR+ gp130 F759/F759 mice are shown in the contour plots. Top and bottom panels show the analysis for female and male mice, respectively. The numbers in the quadrants are the frequencies of the subsets in the T3.70-positive thymocytes. The total cell numbers of thymocytes are indicated on the contour plots. (b) The absolute cell numbers of T3.70+CD8lo thymocytes of male anti-HY TCR+ gp130 WT/WT (white circle), (n = 6) and anti-HY TCR+ gp130 F759/F759 (black circle), (n = 6) mice are shown. Asterisk indicates significant differences by Student's t test (*P < 0.05). Representative data from three independent experiments are shown.
Figure 6.
Figure 6.
Impaired peripheral clonal deletion in gp130F759/F759 mice. SEB (100 μg/mouse) was intraperitoneally injected into 6-wk-old gp130 F759/F759 (black circles) and gp130 WT/WT (white circles) mice on day 0. Peripheral blood was collected on days 0, 3, 7, and 14. The cells were stained with FITC-anti-Vβ8.1/8.2 (a) or -anti-Vβ6 (b) and APC-anti-CD4, and analyzed by flow cytometry. The average frequencies (n = 3) of the specific Vβ-expressing cells in the CD4+ cells are plotted. The error bars indicate SD of three mice. Asterisks indicate significant differences by Student's t test (*P < 0.05). Representative data from three independent experiments are shown.
Figure 7.
Figure 7.
Impaired FasL expression in gp130 F759/F759 T cells in AICD. (a) Purified T cells from gp130 F759/F759 mice (black bars), their littermates (white bars) and gp130 FXXQ/FXXQ fetal liver reconstituted mice (striped bars) were activated with anti-CD3 and anti-CD28 antibodies for 48 h and recultured with IL-2 for 48 h. To induce AICD, live T cells were collected and restimulated with immobilized anti-CD3 antibody in the presence or absence of IL-6 for 20 h. The frequencies of 7-AAD+ dead cells were determined by flow cytometry. Percentage of inhibition of AICD by IL-6 was calculated by [1 – (percentage of dead cells in the presence of IL-6)/(percentage of dead cells in the absence of IL-6)] × 100. Average values of the percentage of inhibition of AICD by IL-6 from three independent experiments are shown. Error bars indicate the SEM. (b) 8 h after AICD induction, the T cells were harvested and stained with PE-anti-FasL, and 7-AAD and analyzed with flow cytometry. White and shaded histograms indicate the staining with anti-FasL and control antibodies, respectively. The numbers indicate the frequencies of FasL-positive cells in 7-AAD T cells. (c) 2 h after induction of AICD, T cells were harvested, and the total RNA was isolated. Transcription levels of FasL mRNA were estimated by quantitative RT-PCR. The relative transcription levels of FasL mRNA in gp130 WT/WT (white bars), gp130 F759/F759 (black bars), and gp130 FXXQ/FXXQ (striped bars) T cells are indicated. The averages from three independent experiments are shown. Error bars indicate the SD. (d) Activated T cells from gp130 WT/WT and gp130 F759/F759 mice and gp130 FXXQ/FXXQ fetal liver reconstituted mice were stimulated with IL-6 for the indicated periods. Cells were lysed and immunoblotted with anti-phosphotyrosine-JAK-1, anti-phosphotyrosine-STAT-3 or anti-STAT-3 antibodies. (e) Activated T cells were stimulated with IL-6 for the indicated periods. Cells were harvested and the total RNA was isolated. Transcription levels of SOCS-3 mRNA were estimated by quantitative RT-PCR. The relative transcription levels of SOCS-3 mRNA in gp130 WT/WT (white circles), and gp130 F759/F759 (black circles) T cells are indicated. Error bars indicate the SD.
Figure 7.
Figure 7.
Impaired FasL expression in gp130 F759/F759 T cells in AICD. (a) Purified T cells from gp130 F759/F759 mice (black bars), their littermates (white bars) and gp130 FXXQ/FXXQ fetal liver reconstituted mice (striped bars) were activated with anti-CD3 and anti-CD28 antibodies for 48 h and recultured with IL-2 for 48 h. To induce AICD, live T cells were collected and restimulated with immobilized anti-CD3 antibody in the presence or absence of IL-6 for 20 h. The frequencies of 7-AAD+ dead cells were determined by flow cytometry. Percentage of inhibition of AICD by IL-6 was calculated by [1 – (percentage of dead cells in the presence of IL-6)/(percentage of dead cells in the absence of IL-6)] × 100. Average values of the percentage of inhibition of AICD by IL-6 from three independent experiments are shown. Error bars indicate the SEM. (b) 8 h after AICD induction, the T cells were harvested and stained with PE-anti-FasL, and 7-AAD and analyzed with flow cytometry. White and shaded histograms indicate the staining with anti-FasL and control antibodies, respectively. The numbers indicate the frequencies of FasL-positive cells in 7-AAD T cells. (c) 2 h after induction of AICD, T cells were harvested, and the total RNA was isolated. Transcription levels of FasL mRNA were estimated by quantitative RT-PCR. The relative transcription levels of FasL mRNA in gp130 WT/WT (white bars), gp130 F759/F759 (black bars), and gp130 FXXQ/FXXQ (striped bars) T cells are indicated. The averages from three independent experiments are shown. Error bars indicate the SD. (d) Activated T cells from gp130 WT/WT and gp130 F759/F759 mice and gp130 FXXQ/FXXQ fetal liver reconstituted mice were stimulated with IL-6 for the indicated periods. Cells were lysed and immunoblotted with anti-phosphotyrosine-JAK-1, anti-phosphotyrosine-STAT-3 or anti-STAT-3 antibodies. (e) Activated T cells were stimulated with IL-6 for the indicated periods. Cells were harvested and the total RNA was isolated. Transcription levels of SOCS-3 mRNA were estimated by quantitative RT-PCR. The relative transcription levels of SOCS-3 mRNA in gp130 WT/WT (white circles), and gp130 F759/F759 (black circles) T cells are indicated. Error bars indicate the SD.
Figure 8.
Figure 8.
Lymphocytes are required for the development of arthritis. gp130 F759/F759 RAG-2 +/− or RAG-2 + / + (white circles) (n = 16) and gp130 F759/F759 RAG-2 / (black circles) (n = 15) mice were examined and scored monthly for severity of arthritis. Data represent means ± SEM.

References

    1. Feldmann, M., F.M. Brennan, and R.N. Maini. 1996. Rheumatoid arthritis. Cell. 85:307–310. - PubMed
    1. Hirano, T. 2002. Revival of the autoantibody model in rheumatoid arthritis. Nat. Immunol. 3:342–344. - PubMed
    1. Feldmann, M., F.M. Brennan, and R.N. Maini. 1996. Role of cytokines in rheumatoid arthritis. Annu. Rev. Immunol. 14:397–440. - PubMed
    1. Hirano, T. 1998. Interleukin 6 and its receptor: ten years later. Int. Rev. Immunol. 16:249–284. - PubMed
    1. O'Shea, J.J., A. Ma, and P. Lipsky. 2002. Cytokines and autoimmunity. Nat. Rev. Immunol. 2:37–45. - PubMed

MeSH terms