. 2002 Oct 15;99(21):13938-43.
doi: 10.1073/pnas.212448699. Epub 2002 Oct 7.

The tomato fer gene encoding a bHLH protein controls iron-uptake responses in roots

Affiliations

The tomato fer gene encoding a bHLH protein controls iron-uptake responses in roots

Hong-Qing Ling et al. Proc Natl Acad Sci U S A. .

Abstract

Iron deficiency is among the most common nutritional disorders in plants. To cope with low iron supply, plants with the exception of the Gramineae increase the solubility and uptake of iron by inducing physiological and developmental alterations including iron reduction, soil acidification, Fe(II) transport and root-hair proliferation (strategy I). The chlorotic tomato fer mutant fails to activate the strategy I. It was shown previously that the fer gene is required in the root. Here, we show that fer plants exhibit root developmental phenotypes after low and sufficient iron nutrition indicating that FER acts irrespective of iron supply. Mutant fer roots displayed lower Leirt1 expression than wild-type roots. We isolated the fer gene by map-based cloning and demonstrate that it encodes a protein containing a basic helix-loop-helix domain. fer is expressed in a cell-specific pattern at the root tip independently from iron supply. Our results suggest that FER may control root physiology and development at a transcriptional level in response to iron supply and thus may be the first identified regulator for iron nutrition in plants.


Figures

Figure 1
Figure 1
Phenotypes of fer mutant and wild-type plants. (A) Iron reductase activity after iron limitation per gram of root per plant, n = 7–15 plants (see also ref. 15). (B) RT-PCR analysis of Leirt1 expression in iron-deficient (−) and iron-sufficient (+) roots. (C) Number of root hairs within 2-mm segments of lateral root tips, n = 25 root tips. (D) Root weight per plant, n = 7–15 plants. (E) Length of the root system per plant, n = 7–15 plants. (F) Length of lateral roots initiated within the 3-cm segments of the main roots containing the main root tip, n = 25–30 lateral roots. Light gray columns, 0.1 μM iron; black columns, 10 μM iron.
Figure 2
Figure 2
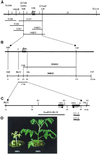
Map-based cloning of the fer gene. (A) High-resolution genetic map of the fer region and establishment of a YAC and BAC contig. The fer gene (gray box) was located within the region ranging from RFLP markers TG590 to TG118 on chromosome 6 (bold line). The genetic locations of markers are indicated as vertical lines. Numbers above the bold line designate recombination events between the indicated markers. Horizontal lines below the fer region indicate the locations of YAC and BAC clones. (B) Genetic and physical location of markers derived from the sequence of BAC 56B23 and BAC 53M23. Rk32 and 16k are RFLP markers developed based on BAC-sequencing data. Numbers above the bold line designate recombination events between the indicated markers and fer. The numbers below the line representing BAC 56B23 indicate the physical distance of the respective markers in kilobases from the left end of the BAC clone. (C) Analysis of the 17-kb region containing the fer gene. ORFa and ORFb are two ORFs detected by the sequence analysis. Arrows indicate the direction of the ORF. RV represents EcoRV restriction sites. C1-2 and C2-8 represent two cDNA constructs of fer used for complementation. EcoRV6.0K+X is a genomic transformation construct containing ORFa. (D) Transgenic fer plants containing the ORFa construct (noncomplemented) and the ORFb C1-2 construct (complemented): C2-8 complemented similarly.
Figure 3
Figure 3
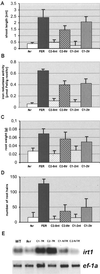
Phenotypic analysis of segregating progenies of two complemented transgenic fer plants containing a single ORFb T-DNA insertion of C2-8 and C1-2, respectively. The genotypes of the progeny were confirmed by Southern blot hybridization and PCR. The experiments were performed on plants grown at 0.1 μM iron. fer and FER are the control lines T3238fer and T3238FER. C2-8nt and C1-2nt regroup the nontransgenic individuals. C2-8tr and C1-2tr regroup the transgenic individuals. (A) Average length of the shoots per plant measured between the hypocotyls and shoot apex. (B) Average root iron-reductase activity per gram root per plant. (C) Average weight of the root system per plant. (D) Average number of root hairs per 2-mm section containing a lateral root tip. (E) RT-PCR expression analysis of Leirt1 in roots of wild type and fer as well as the transgenic (TR) and nontransgenic (NTR) C1-2 (C1) and C2-8 (C2) lines. As positive control, expression of elongation factor Leef-1a was monitored.
Figure 4
Figure 4
Structural analysis of the fer gene. (A) Gene structure of fer. The upper drawing shows in hatched boxes exons 1–4 separated by three introns indicated by white boxes. The lengths of the three introns are indicated in base pairs. The lower part shows the structure of the predicted protein gene product. The black box delimits the position of the bHLH domain. (B) Predicted amino acid sequence encoded by the fer gene. The underlined amino acids form the bHLH motif. (C) RFLP of the fer alleles of the mutant T3238fer and the wild-type lines L. esculentum T3238FER (progenitor of T3238fer) and cv. Moneymaker. Genomic DNA was digested with EcoRV and probed with the fer cDNA. (D) Location of the insertion in the fer allele of T3238fer. Arrowheads indicate the positions of various primers used for amplification of different regions of the fer gene. The black bar between R3 and F5 indicates the DNA region that could not be amplified by PCR with any primer combination from the mutant, indicating that a large insertion was present in this region.
Figure 5
Figure 5
RT-PCR expression analysis of the fer gene. (A) Expression in various tissues of tomato: r, entire roots; rt, root tips; hy, hypocotyls; cot, cotyledons; l, leaves. As positive control, expression of elongation factor Leef-1a was monitored. (B) Root expression in response to iron supply: 0, before the start of the experiment; 1d–8d, 1–8 days of growth after iron limitation (0.1 μM iron) or sufficient iron supply (10 μM iron).
Figure 6
Figure 6
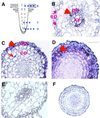
Localization of fer expression by in situ hybridization. (A) Schematic representation of a longitudinal section through a root. Dotted lines indicate the locations of transverse sections analyzed in BD. (BD) In situ hybridization analysis of fer transcripts using a fer antisense probe on 10-μm transverse sections through root tips. The sections were derived from the mature root-hair zone (B), the elongation zone (C), and the dividing root zone after the meristem (D). ph, phloem; xy, xylem; ep, root epidermis; co, cortex. Red arrowheads indicate fer expression. The thin red arrow indicates weak fer expression in the cortex. (E and F) Control hybridization using a fer sense probe. No signal was detected.

References

    1. Guerinot M L. Science. 2000;287:241–243. - PubMed
    1. World Health Organization. Battling Iron Deficiency Anaemia. 2002. www.who.int/nut/ida.htm , www.who.int/nut/ida.htm. .
    1. Wu J, Boyle E, Sunda W, Wen L-S. Science. 2001;293:847–849. - PubMed
    1. Geider R J. Nature. 1999;400:815–816.
    1. Guerinot M L. Nat Biotechnol. 2001;19:417–418. - PubMed

Publication types

Associated data