

Predicting the effects of climate change on avian life-history traits
- PMID: 12370441
- PMCID: PMC129719
- DOI: 10.1073/pnas.212251999
Predicting the effects of climate change on avian life-history traits
Abstract
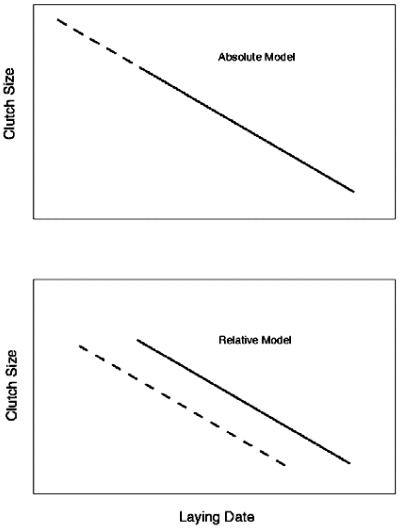
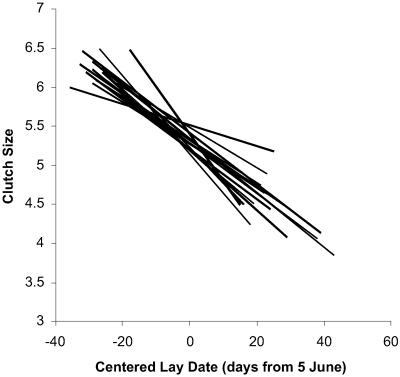
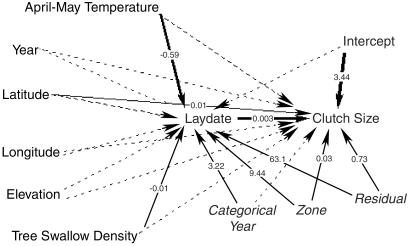
Across North America, tree swallows have advanced their mean date of clutch initiation (lay date) by approximately 9 days over the past 30 years, apparently in response to climate change. In a sample of 2,881 nest records collected by the lay public from 1959 to 1991, we examined whether clutch size has also responded to climate change. We found that clutch size is strongly related to lay date, both within and among years, and there has been no significant temporal variation in the slopes or intercepts of the clutch-size/lay-date regressions. As a consequence, we expected increases in clutch size with advancement in lay date; however, we detected no such trend over time. The distributions of egg-laying dates were more constricted in the warmest (and earliest) years, suggesting that changes in mean clutch size might be constrained by changes in the distribution of laying dates. If spring temperatures continue to increase, we predict further reductions of variance in laying dates and relatively small increases in clutch size. Such constraints on life-history variation probably are common and need to be considered when modeling the effects of climate change on reproduction in natural populations. Predicting the long-term effects of constraints and interpreting changes in life-history traits require a better understanding of both adaptive and demographic effects of climate change.
Figures
Comment in
-
Climate, changing phenology, and other life history traits: nonlinearity and match-mismatch to the environment.Proc Natl Acad Sci U S A. 2002 Oct 15;99(21):13379-81. doi: 10.1073/pnas.212519399. Epub 2002 Oct 7. Proc Natl Acad Sci U S A. 2002. PMID: 12370424 Free PMC article. Review. No abstract available.
References
-
- Intergovernmental Panel on Climate Change. Climate Change 2001: Third Assessment Report of the Intergovernmental Panel on Climate Change. Cambridge: Cambridge Univ. Press; 2001.
-
- Winkel W, Hudde H. J Avian Biol. 1997;28:187–190.
-
- Crick H Q P, Dudley C, Glue D E, Thomson D L. Nature. 1997;388:526.
-
- McCleery R H, Perrins C M. Nature. 1998;391:30–31.
Publication types
MeSH terms
LinkOut - more resources
Full Text Sources
Research Materials
Miscellaneous
