. 2002 Oct 15;99(21):13538-43.
doi: 10.1073/pnas.212358999. Epub 2002 Oct 7.

Single molecule analysis of RNA polymerase elongation reveals uniform kinetic behavior

Affiliations

Single molecule analysis of RNA polymerase elongation reveals uniform kinetic behavior

Karen Adelman et al. Proc Natl Acad Sci U S A. .

Abstract

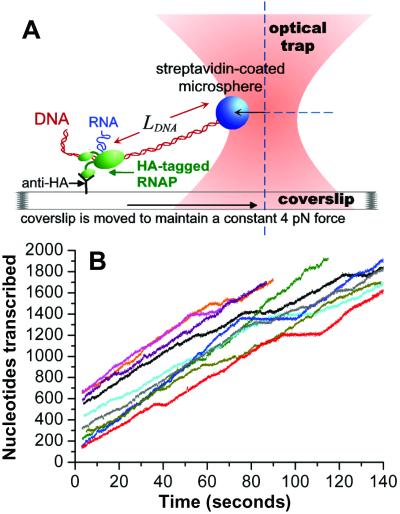
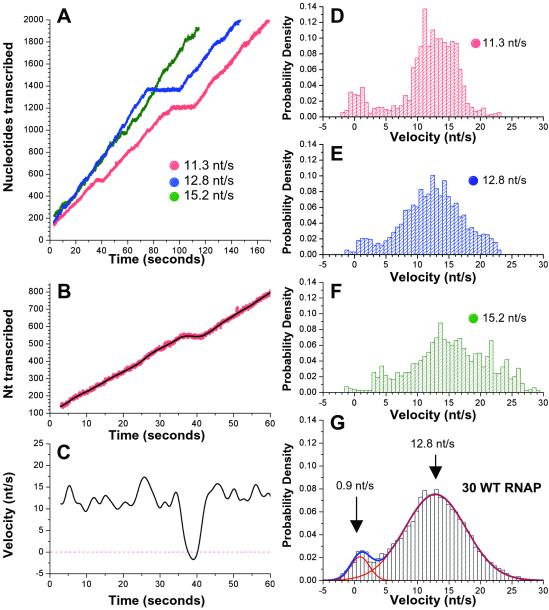
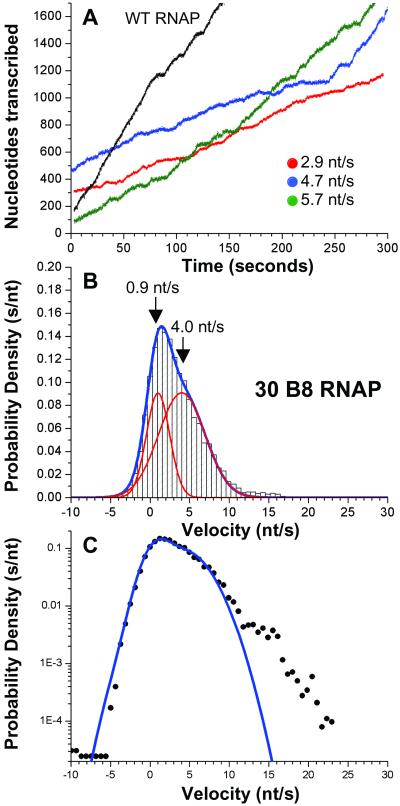
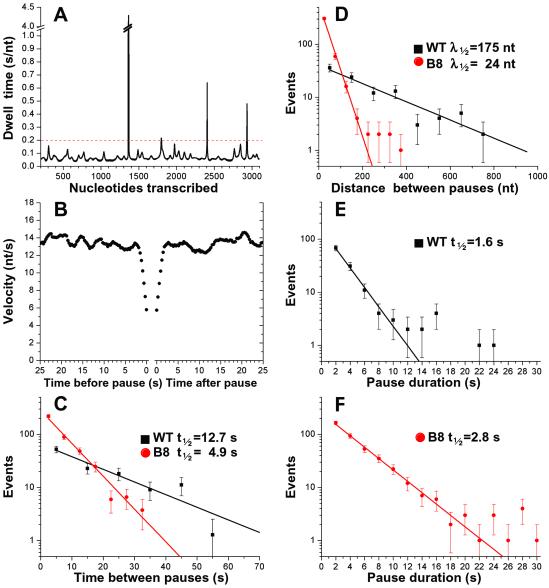
By using single-molecule measurements, we demonstrate that the elongation kinetics of individual Escherichia coli RNA polymerase molecules are remarkably homogeneous. We find no evidence of distinct elongation states among RNA polymerases. Instead, the observed heterogeneity in transcription rates results from statistical variation in the frequency and duration of pausing. When transcribing a gene without strong pause sites, RNA polymerase molecules display transient pauses that are distributed randomly in both time and distance. Transitions between the active elongation mode and the paused state are instantaneous within the resolution of our measurements (<1 s). This elongation behavior is compared with that of a mutant RNA polymerase that pauses more frequently and elongates more slowly than wild type.


Figures

Figure 1
Figure 1
Experimental setup and raw data. (A) A stalled ternary elongation complex composed of E. coli RNAP bearing an HA-epitope tag, template DNA, and a short RNA was specifically immobilized on a coverslip surface through interaction with a nonspecifically adsorbed anti-HA antibody. A streptavidin-coated microsphere was attached to a biotin located on the downstream end of the DNA. The microsphere was held at a fixed position relative to the optical trap throughout elongation. During transcription, the template DNA was pulled through the RNAP, leading to a decrease in length of downstream DNA (LDNA). Feedback control moved the coverslip toward the optical trap so that a constant force of 4 pN was maintained on the RNAP. Force of this magnitude has been shown to have no detectable effect on elongation rate or pausing (11, 12). (B) Elongation profiles of 10 single RNAP molecules are plotted as nucleotides transcribed vs. time.
Figure 2
Figure 2
Analysis of elongation velocity. (A) Elongation by three RNAP molecules, expressed as nucleotides transcribed vs. time. Overall transcription rates are designated for each RNAP. (B and C) Magnified views of the first 60 s of elongation by one RNAP (red, as in A). The black curves are the nucleotide position (B) and the instantaneous velocity derived from our filtering procedure (C). (DF) Normalized distributions of instantaneous velocity (s/nt) for the RNAPs shown in A. (G) The combined normalized distribution for 30 WT RNAPs is fit by two Gaussian functions (shown in red, overall fit in blue). The component that represents the paused state is centered at 0.9 nt/s (SD = 1.5 nt/s; area = 7.8%) and the component reflecting active elongation is centered at 12.8 nt/s (SD = 4.9 nt/s; area = 92.2%).
Figure 3
Figure 3
Elongation by the RpoB8 mutant RNAP. (A) Elongation by three representative B8 RNAP molecules shown in color, with one WT trace shown in black for comparison. (B) The combined normalized distribution of velocity from 30 B8 RNAP is fit by two Gaussian functions (each shown in red, overall fit in blue). The distribution that represents pausing, centered at 0.9 nt/s (SD = 1.5 nt/s; area = 33.3%) significantly overlaps the component that corresponds to active elongation, centered around 4.0 nt/s (SD = 5.9 nt/s; area = 66.7%). (C) The fit to two Gaussian functions (blue line) and the normalized distribution (filled circles) plotted vs. velocity on a semilog graph.
Figure 4
Figure 4
Pause frequency and duration. (A) Dwell time vs. nucleotide position for one WT RNAP molecule (shown in Fig. 2A, blue). (B) The average of the instantaneous velocity as a function of the time before the beginning of a pause (Left) or since the end of a pause (Right) for all pauses by WT RNAPs (0.3-s intervals). (C) The number of pauses that occurred within a given time interval after the previous pause (10-s bins for WT RNAP, 5-s bins for B8 RNAP) is plotted vs. time on a semilog graph. The lines are the fits to exponential decay, (WT RNAP t1/2 = 12.7 s, P = 0.37; B8 RNAP t1/2 = 4.9 s; P = 0.29). (D) The distribution of distances between consecutive pauses (100-nt bins for WT RNAP, 50-nt bins for B8 RNAP) is plotted vs. distance on a semilog graph. Single exponential fits of the data yield the half-distances between pauses (WT RNAP λ1/2 = 175 nt; P = 0.29; B8 RNAP fit between 0–200 nt λ1/2 = 24 nt; P = 0.18). The distribution of pause durations (2-s bins) is shown for WT RNAP (E) or B8 RNAP (F). Shown are exponential fits to the data representing pauses that last ≤10 s for WT RNAP (t1/2 = 1.6 s; P = 0.81) and ≤16 s for B8 RNAP (t1/2 = 2.8 s; P = 0.32).

References

    1. Guajardo R, Sousa R. J Mol Biol. 1997;265:8–19. - PubMed
    1. von Hippel P H. Science. 1998;281:660–665. - PubMed
    1. Nudler E. J Mol Biol. 1999;288:1–12. - PubMed
    1. Korzheva N, Mustaev A. Curr Opin Microbiol. 2001;4:119–125. - PubMed
    1. Lis J T. Cold Spring Harbor Symp Quant Biol. 1998;63:347–356. - PubMed

Publication types

MeSH terms

Substances