. 2002 Sep 19;3(10):research0054.
doi: 10.1186/gb-2002-3-10-research0054. Epub 2002 Sep 19.

Genomic analysis of membrane protein families: abundance and conserved motifs

Affiliations

Genomic analysis of membrane protein families: abundance and conserved motifs

Yang Liu et al. Genome Biol. .

Abstract

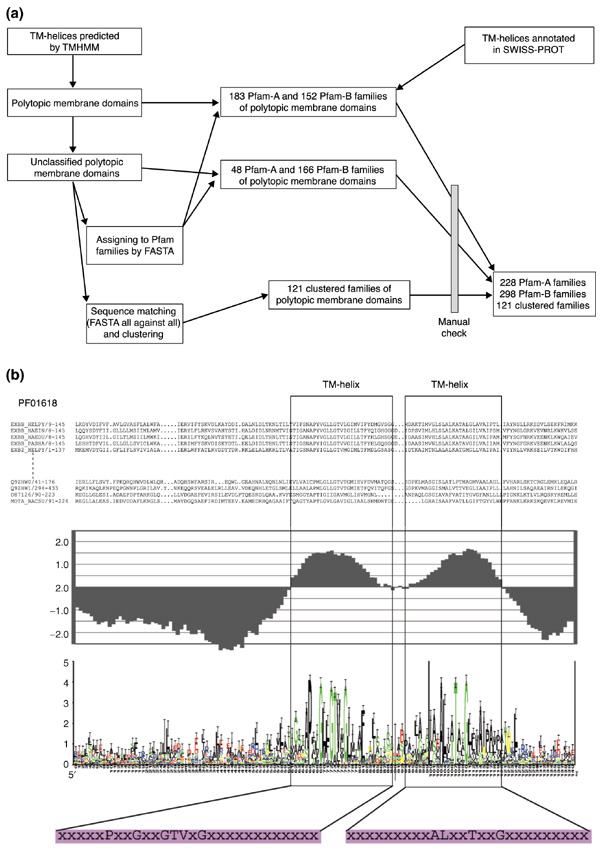
Background: Polytopic membrane proteins can be related to each other on the basis of the number of transmembrane helices and sequence similarities. Building on the Pfam classification of protein domain families, and using transmembrane-helix prediction and sequence-similarity searching, we identified a total of 526 well-characterized membrane protein families in 26 recently sequenced genomes. To this we added a clustering of a number of predicted but unclassified membrane proteins, resulting in a total of 637 membrane protein families.

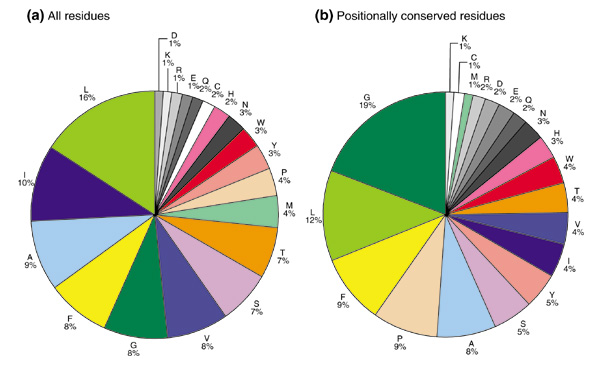
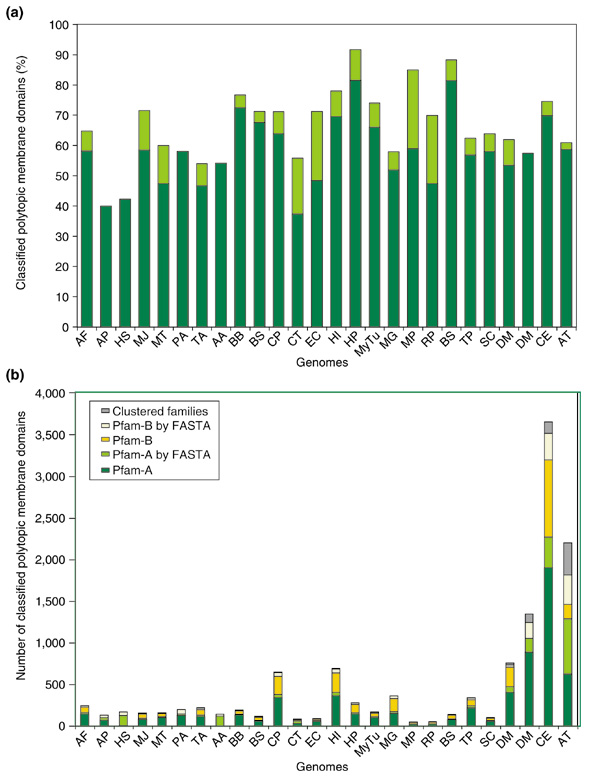
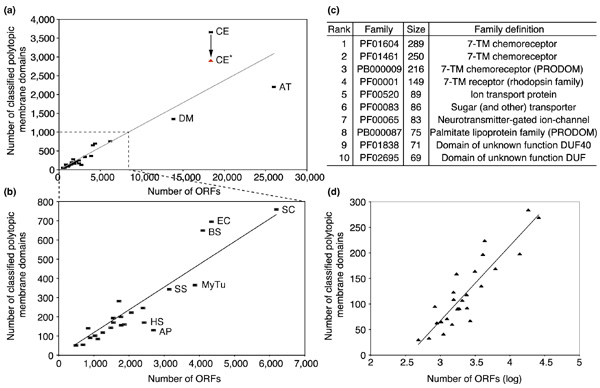
Results: Analysis of the occurrence and composition of these families revealed several interesting trends. The number of assigned membrane protein domains has an approximately linear relationship to the total number of open reading frames (ORFs) in 26 genomes studied. Caenorhabditis elegans is an apparent outlier, because of its high representation of seven-span transmembrane (7-TM) chemoreceptor families. In all genomes, including that of C. elegans, the number of distinct membrane protein families has a logarithmic relation to the number of ORFs. Glycine, proline, and tyrosine locations tend to be conserved in transmembrane regions within families, whereas isoleucine, valine, and methionine locations are relatively mutable. Analysis of motifs in putative transmembrane helices reveals that GxxxG and GxxxxxxG (which can be written GG4 and GG7, respectively; see Materials and methods) are among the most prevalent. This was noted in earlier studies; we now find these motifs are particularly well conserved in families, however, especially those corresponding to transporters, symporters, and channels.

Conclusions: We carried out a genome-wide analysis on patterns of the classified polytopic membrane protein families and analyzed the distribution of conserved amino acids and motifs in the transmembrane helix regions in these families.


Figures

Figure 1
Figure 1
Classification of polytopic membrane domains. (a) Procedure for classifying polytopic membrane domains. Through automatic classification and manual examination, 228 Pfam-A, 299 Pfam-B and 121 clustered families were classified. (b) An example profile (PF01618) of a classified family of polytopic membrane domains consists of (from top to bottom): sequence alignment; an averaged hydrophobicity plot based on GES hydrophobicity value; consensus sequence displayed by sequence logo with conserved residues in hydrophobic regions highlighted; consensus sequences of TM-helices, where only conserved amino acids are shown in the single-letter code (with the remainder represented by "x").
Figure 2
Figure 2
Number of TM-helices in Pfam-A families of polytopic membrane domains. Shown are the number of Pfam-A families of polytopic membrane domains with a given number of TM-helices. Only families with more than 20 members were counted. The green bars indicate numbers from all studied Pfam-A families and the yellow bars those from the Pfam-A families that are annotated as transporters, symporters, and channels.
Figure 3
Figure 3
Amino-acid compositions of TM-helices. The amino-acid composition in the TM-helical regions (a) for all sequences and of consensus sequences, and (b) for the 168 Pfam-A families of polytopic membrane domains that contain more than 20 members.
Figure 4
Figure 4
Classified polytopic membrane domains in 26 genomes. (a) The dark-green bars represent the percentage of polytopic membrane domains that are classified in each genome, using only classified families with at least four members. When classified families containing two or three members are included in this analysis, the additional coverage is represented by light-green bars. (b) The proportion of polytopic membrane domains classified by different methods in all genomes studied. Most polytopic membrane domains are identified by direct ID match and sequence-similarity (FASTA) match to members of classified Pfam-A families (green and light-green bars) and Pfam-B families (yellow and light-yellow bars). A small proportion of polytopic membrane domains are clustered on the basis of their sequence similarity (gray bars). For abbreviations for genomes, see Materials and methods.
Figure 5
Figure 5
Classified polytopic membrane domains in relation to the number of ORFs in the 26 genomes studied. (a, b) Plots of the number of classified polytopic membrane domains versus the number of ORFs in (a) all the studied genomes and (b) in genomes of single-celled organisms. The trend lines, though generated on the basis of data in each plot, have almost the same slope. CE* in red indicates the number of classified polytopic membrane domains in C. elegans after the three big 7-TM chemoreceptor families are removed (see (c)). (c) The top ten families of polytopic membrane domains, as judged by their occurrence in C. elegans.(d) Plot of the number of classified families of polytopic membrane domains versus the logarithm of the number of ORFs in each genome.

Similar articles

Cited by

References

    1. Paulsen IT, Sliwinski MK, Saier MHJ. Microbial genome analyses: global comparisons of transport capabilities based on phylogenies, bioenergetics and substrate specificities. J Mol Biol. 1998;277:573–592. - PubMed
    1. Paulsen IT, Nguyen L, Sliwinski MK, Rabus R, Saier MHJ. Microbial genome analyses: comparative transport capabilities in eighteen prokaryotes. J Mol Biol. 2000;301:75–100. - PubMed
    1. Gerstein M. A structural census of genomes: comparing bacterial, eukaryotic, and archaeal genomes in terms of protein structure. J Mol Biol. 1997;274:562–576. - PubMed
    1. Gerstein M. Patterns of protein-fold usage in eight microbial genomes: a comprehensive structural census. Proteins. 1998;33:518–534. - PubMed
    1. Wallin E, von Heijne G. Genome-wide analysis of integral membrane proteins from eubacterial, archaean, and eukaryotic organisms. Protein Sci. 1998;7:1029–1038. - PMC - PubMed

Publication types

Substances

LinkOut - more resources